


fig5
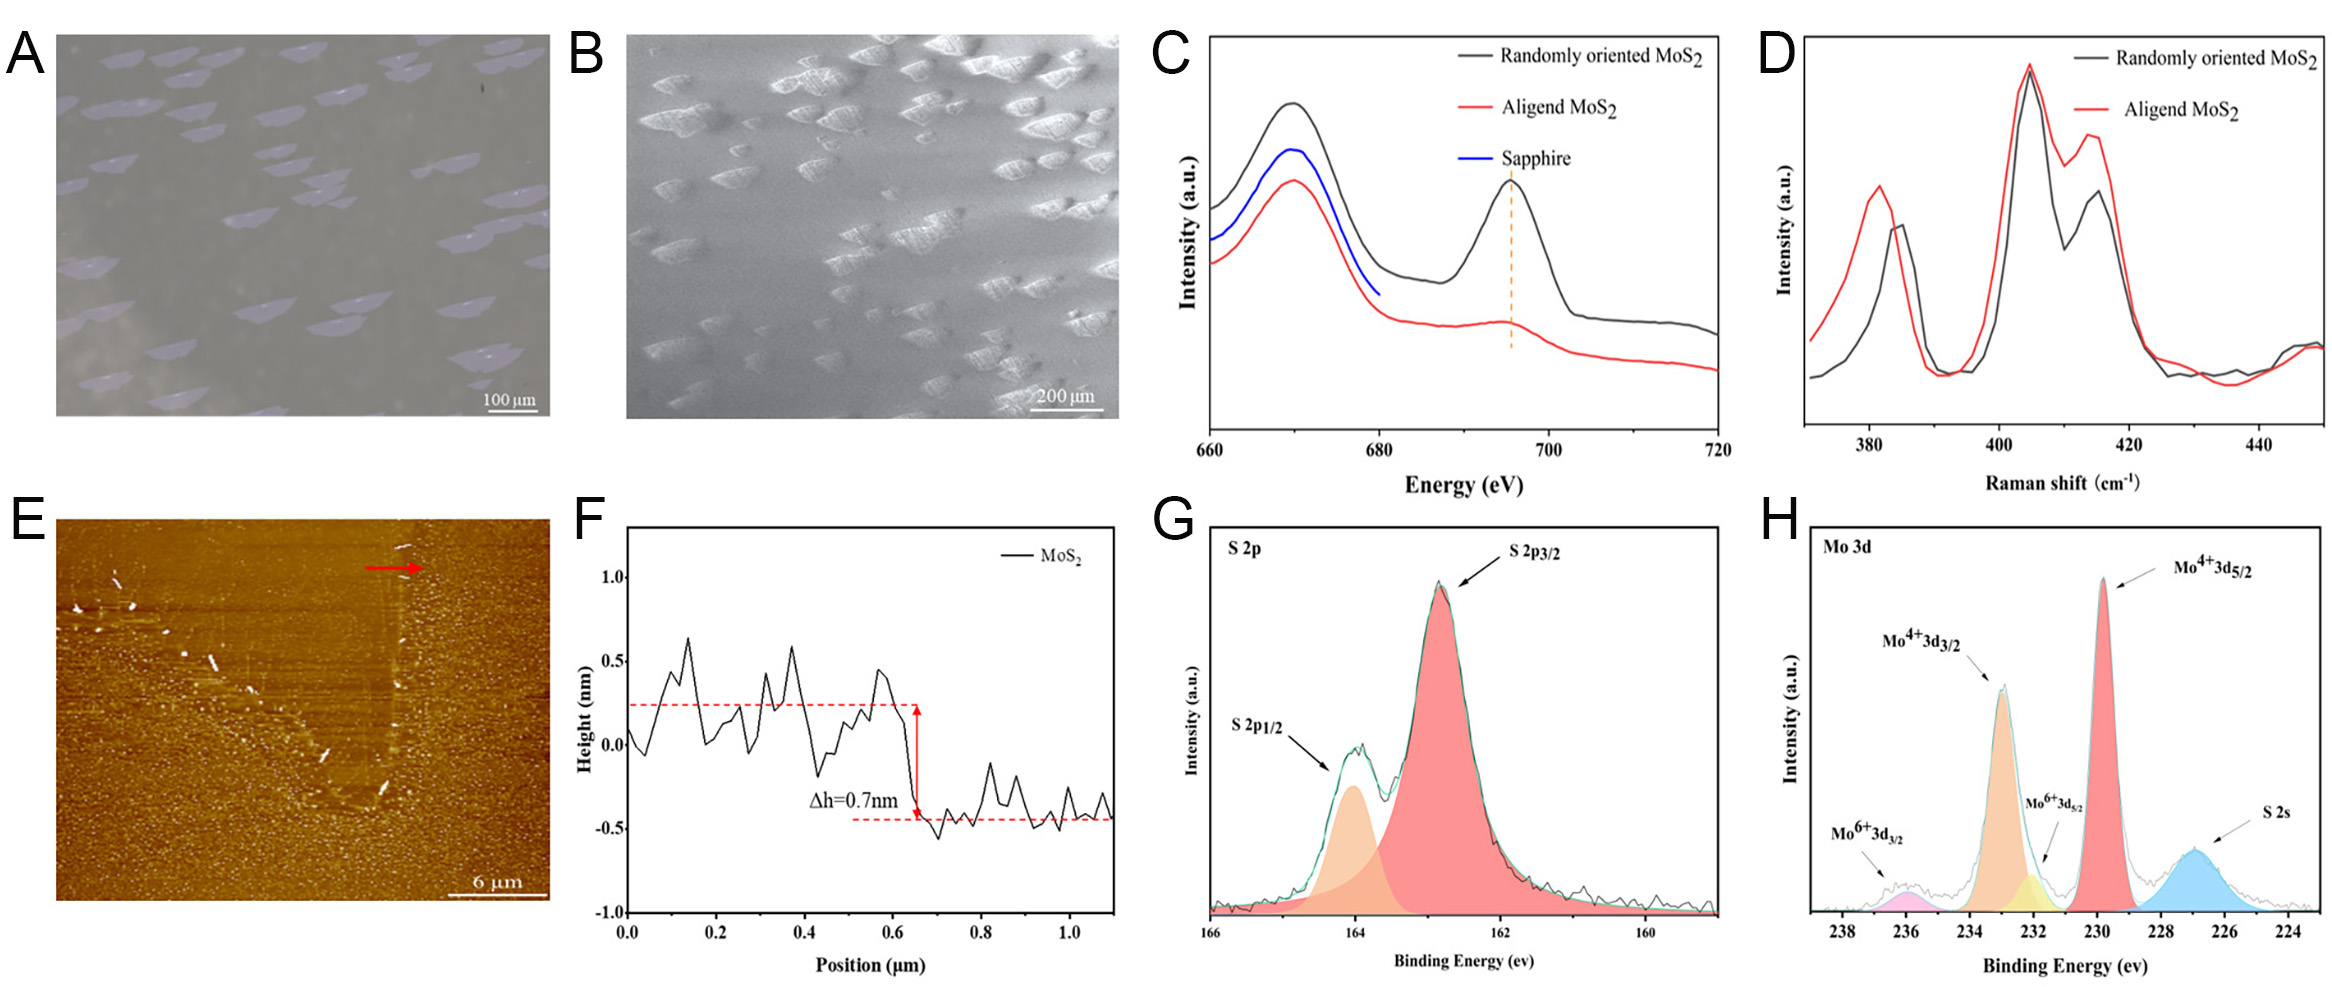
Figure 5. (A) OM image of the CVD deposited aligned MoS2. (B) SEM image of the CVD deposited aligned MoS2. (C) PL spectra of aligned MoS2 (red line) and randomly oriented MoS2 (black line). (D) Raman spectra of aligned MoS2 (red line) and randomly oriented MoS2 (black line). (E) AFM image of the MoS2 flake. The height profile (F) is along the red lines in (E). XPS spectra of (G) S 2p and (H) Mo 3d.


