


fig1
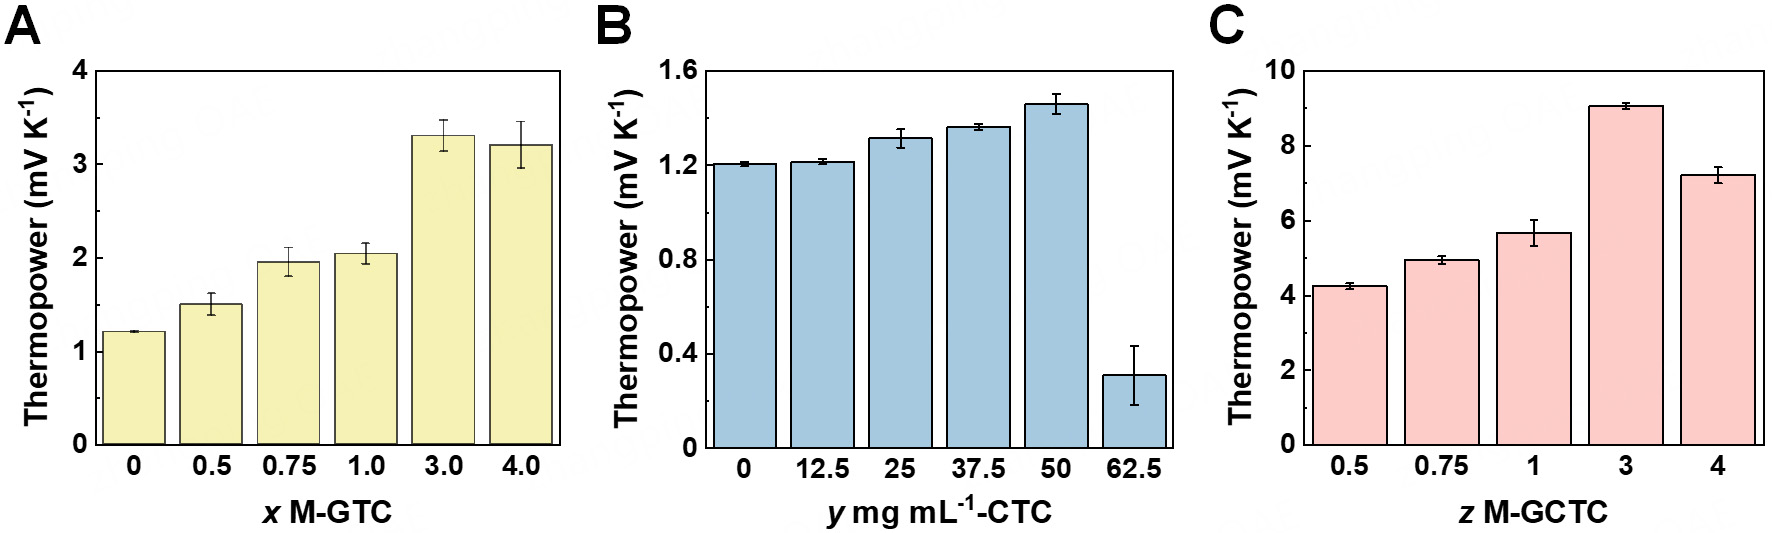
Figure 1. Thermopower of the thermocell systems. (A) GTCs with different molar concentrations of GdnHCl (x M-GTCs); (B) CTCs with different mass concentrations of CH (y mg mL-1-CTCs); (C) GCTCs with 50 mg mL-1 CH and different molar concentrations of GdnHCl (z M-GCTCs). Error bars represent the standard deviation of repeated measurements under the same experimental conditions. GTCs: GdnHCl-regulated thermocells; CTCs: CH-regulated thermocells; GCTCs: GdnHCl-CH-co-regulated thermocells.


