


Boosted thermopower in aqueous thermocells through additives-induced ionic regulation for low-grade heat harvesting
 0
0 Abstract
Aqueous thermocells are promising techniques for the conversion of low-grade waste heat into electricity. However, current improvement strategies are mainly focused on single redox ions and sacrifice the electrical conductivity due to concentrated molecular additives. Herein, we report a chemical additives-regulated thermocell that introduced two ionic additives, guanidine hydrochloride and cysteamine hydrochloride, into 0.4 M ferri/ferrocyanide {[Fe(CN)6]3-/4-} electrolyte to simultaneously exert the selective crystallization effect on [Fe(CN)6]4- and the chemical regulation effect for [Fe(CN)6]3-, synergistically inducing concentration gradients of both redox ions between two electrodes, thereby improving the thermoelectric performance. Our thermocell obtained a high thermopower of 4.34 mV K-1 with comparable electrical conductivity and a Carnot-relative efficiency of 5.50% with minimal amounts of the two additives, showing adaptability to various cell orientations and thus different practical scenarios. A record-high thermopower of 9.06 mV K-1 and a Carnot-relative efficiency of 12.65% were achieved by adopting optimized concentrations of two additives under cold-over-hot orientation. A 20-unit module was developed to directly power various electronics, demonstrating its feasibility for low-grade heat harvesting.

Keywords
INTRODUCTION
Low-grade heat (< 100 °C) is an abundant energy source, spreading over a variety of natural and industrial processes, such as solar and geothermal energy, the human body, transportation, etc.[1,2]. Recovery of
For thermocell systems, thermopower is the thermovoltage generated under a temperature difference (∆T), which is associated with the solvent-dependent entropy difference (∆S) between redox ions and the concentration difference (∆C) of redox ions between hot and cold electrodes[17,18]. In other words, thermopower can be enhanced by increasing ∆S of the redox ions or introducing ∆C. A higher ∆S can be realized by regulating the interactions between the redox ions and the solvents, such as a rearrangement of the solvation shell by adopting organic redox couples or additives[19-24]. In a 0.4 M ferri/ferrocyanide {[Fe(CN)6]3-/4-} electrolyte system, chaotropic guanidinium chloride and polar urea were employed as additives to obtain a thermopower of 4.2 mV K-1. However, the electrical conductivity of the system
Herein, we introduced guanidine hydrochloride (GdnHCl) and cysteamine hydrochloride (CH) into
EXPERIMENTAL
Materials
Potassium ferricyanide [K3Fe(CN)6, ACS, ≥ 99.0%], potassium ferrocyanide trihydrate [K4Fe(CN)6·3H2O, ACS, 98.5%-102.0%], guanidine hydrochloride (GdnHCl, 99.5%), cysteamine hydrochloride (CH, 98%), and cystamine dihydrochloride (CDH, > 97.0%) were purchased from Aladdin Biochemical Technology Co., Ltd. (Shanghai, China). Deuterium oxide (D2O, 99.9 atom % D) was purchased from MREDA Technology Co., Ltd. (Beijing, China). All chemicals were used as received without further purification. Graphite plates were commercial products purchased from Tailin Graphite Company (Guangdong, China). Water used in all experiments was deionized (DI) water from a Milli-Q ultrapure water purification system (Millipore, France). The Very High Bond (VHB) tape was obtained from 3M (U.S.).
Fabrication of GCTC devices and the integrated module
K3Fe(CN)6 (658.5 mg) and K4Fe(CN)6·3H2O (844.8 mg) were dissolved in DI water to prepare 5 mL of the 0.4 M potassium ferri/ferrocyanide {[Fe(CN)6]3-/4-} electrolyte as one-cell amount in all experiments. Then a mixture of different molar concentrations of GdnHCl and various mass concentrations of CH were weighed corresponding to the volumetric amount of the pristine [Fe(CN)6]3-/4- electrolyte to be added. The GCTC electrolyte was obtained by adding the pristine electrolyte into the mixture of GdnHCl and CH and subsequent magnetic stirring at 300 rpm for 10 min at 70 °C until the additives were completely dissolved. As the primary focus of this study, 5 mL of the 0.4 M [Fe(CN)6]3-/4- solution was added into a vial containing a mixture of GdnHCl (238.8 mg) and CH (250 mg) to form 0.5 M GdnHCl-50 mg mL-1 CH-co-regulated electrolyte. In the case of GCTCs with a high concentration of GdnHCl (e.g., 3.0 M), GdnHCl was first added into the pristine electrolyte, allowing it to fully dissolve, then CH was added into the
The single planar cell was composed of a poly(methyl methacrylate) (PMMA) frame with an internal volume of 3.375 cm3 (1.5 cm × 1.5 cm × 1.5 cm), which was sandwiched by two plain graphite plates as electrodes with a thickness of 2 mm without any further modification. The components were sealed using VHB tapes with a thickness of 1.1 mm, which were hollowed out to have a square void with a side length of 1.5 cm and positioned between the PMMA frame and graphite electrodes. The cross-sectional area of the cell was 2.25 cm2, and the distance between the two electrodes was 1.72 cm. The homogeneous electrolyte was injected into the planar cell using a syringe immediately after dissolving.
To fabricate the integrated GCTC module, a PMMA frame consisting of 20 individual cells was first sealed by graphite plates with a thickness of 2 mm using the VHB tapes. Then the individual cells were connected in series by conductive fabric tapes. Conductive silver paste was used to ensure the adhesion between the graphite electrodes and the conductive fabric tapes as well as promoting the electrical contact between them. The cross-sectional area of a single cell was 2.5 cm2 (2.5 cm × 1.0 cm), and the distance between the two electrodes was 1.72 cm. Finally, the homogeneous electrolyte was injected into the as-fabricated module for the demonstration.
Characterization and measurements
Thermovoltage and V-I-P measurement
The Voc was recorded by an electrochemical workstation (CHI 660E, Shanghai Chenhua Instrument Corp). The temperature difference between two electrodes of the thermocells was maintained by a homemade temperature acquisition & feedback system employing the LabVIEW program with two thermoelectric modules. Two thermocouples were placed upon and underneath the thermocell to read and record the temperatures at the electrodes, which were processed by the LabVIEW program so that the thermoelectric modules were controlled to reach the input temperature values, providing designated temperature differences toward the two electrodes. The current-voltage curves, employing the same experimental setup as that for thermopower measurement, were obtained by sweeping the voltage from the Voc to 0 V for the cells under the temperature differences. The corresponding power output was acquired by multiplying the current and voltage. For the large-scale module, the temperature difference was created by a hot plate on the bottom, and an aluminum heat exchanger on the top with cooling water circulating through, which was read from a thermometer using K-type thermocouples for temperature sensing.
Electrical conductivity measurement
The electrical conductivity of GCTCs was determined via electrochemical impedance spectroscopy (EIS) conducted on the identical cell configuration and experimental setup as the one for the thermopower measurement, except using Autolab (PGSTAT302N, Metrohm) instead of the electrochemical workstation. The cells were tested under the open circuit condition with a voltage amplitude of 20 mV in the frequency range from 1 to 105 Hz. The resistances were attained via the first intercept of the high frequency on the horizontal axis from Nyquist plots. The electrical conductivity of the thermocells can be calculated as
where l is the distance between the two electrodes, R is the resistance, and S is the contact area between the electrolyte and electrode.
Thermal conductivity measurement
The thermal conductivity of the thermocells was measured via a steady-state method. Since there are thermal conduction and thermal convection occurring in the liquid electrolyte in the thermocells under temperature differences, the steady-state method takes both factors into account[26,29,30]. A planar cell shaped as a rectangular cuboid was composed of two PMMA plates (50 mm × 50 mm × 5 mm) with a thermal conductivity of 0.16 W m-1 K-1, and four polyethylene terephthalate (PET) sheets (50 mm × 15 mm ×
where κ is the thermal conductivity, A is the cross-section area of the cell, and ∂T/∂d is the temperature change with distance within each component. For our setup, κbottom wall = κtop wall.
Cyclic voltammetry characterization
The cyclic voltammetry (CV) measurements were conducted based on an electrochemical workstation. The three-electrode CV characterizations were conducted using a graphite sheet (size: 1 × 1 cm2) as the working electrode, a platinum foil (size: 0.5 × 2 cm2) as the counter electrode, and an Ag/AgCl in saturated KCl solution as the reference electrode at a scan rate of 10 mV s-1. The solution for all CV analyses was prepared by adding 15 mL DI water into a mixture of 1 mL 0.4 M [Fe(CN)6]4- aqueous solution and 4 mL 2.5 M KCl electrolyte. That is, 0.02 M [Fe(CN)6]4- aqueous solution and 0.5 M KCl as the supporting electrolyte were employed. For CV analyses involving GdnHCl and CH, the solution preparation procedures were similar but with sole GdnHCl, sole CH, or both GdnHCl and CH added into the mixture. The temperatures were controlled via a thermostat water bath (SUNNE, SY-DF3-1A) from room temperature to 343 K with each step of an increment of 10 K.
X-ray diffraction characterization
The induced precipitates were retrieved from the thermocells, washed with DI water, and then vacuum dried at 333 K overnight. The pure K3Fe(CN)6, K4Fe(CN)6, GdnHCl, and the dried crystals were ground into powders for the X-ray diffraction (XRD) characterization using the X-ray diffraction system (Rigaku SmartLab SE).
Ultraviolet-visible spectroscopy characterization
The ultraviolet-visible (UV-Vis) absorption spectra were obtained using a UV-Vis spectrophotometer (LAMBDA 365, PerkinElmer). The electrolytes, with or without the additives, were prepared via the same procedure as that for fabricating a thermocell, which were further diluted to have the base [Fe(CN)6]3-/4- in a concentration of 1 × 10⁻⁴ M.
<sup>1</sup>H nuclear magnetic resonance characterization
The evolution of the additives in the pristine electrolyte was tracked using the nuclear magnetic resonance (NMR) system (Bruker ASCEND AVANCE III, 400 MHz). The mass concentration of CH was fixed at
RESULTS AND DISCUSSION
Thermopower of GCTCs
The effect of different concentrations of a single additive, GdnHCl or CH [Supplementary Figure 1A and B], on the thermopower of the thermocells was first investigated. The thermocell, which exclusively incorporates different molar concentrations of GdnHCl (x M) and different mass concentrations of CH
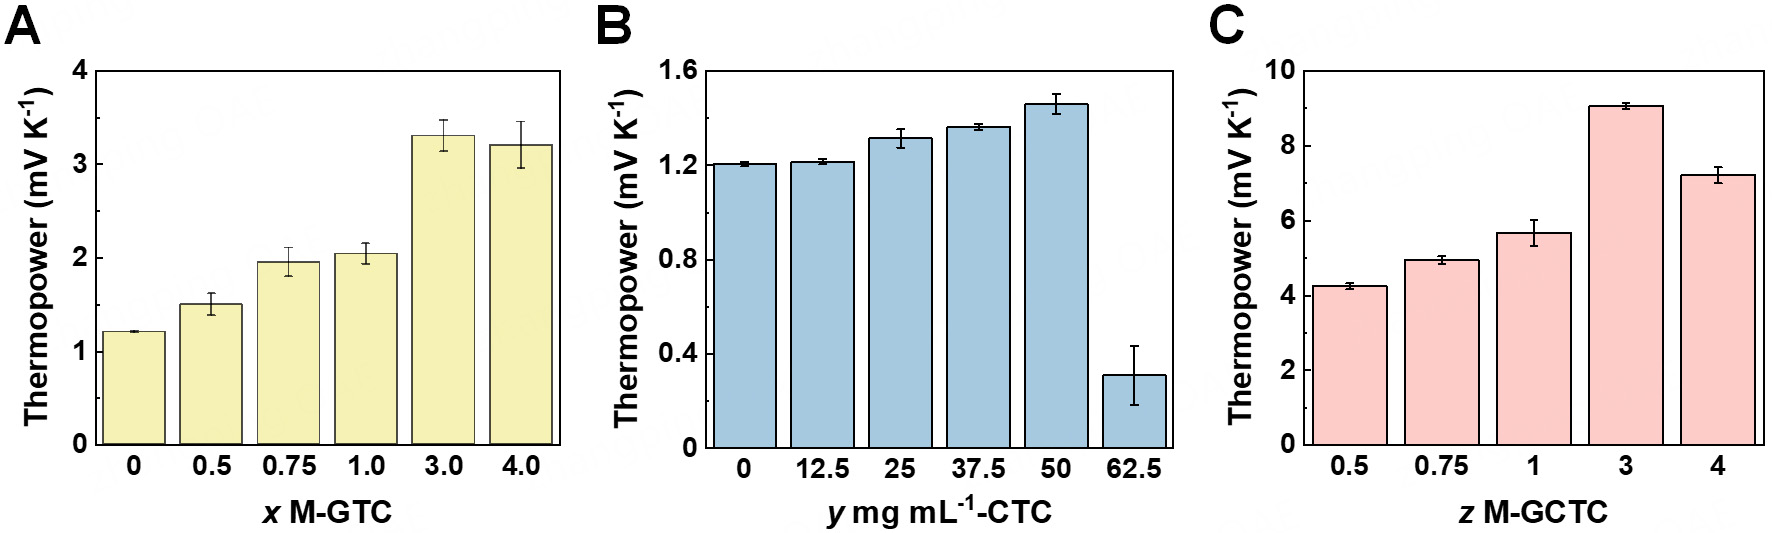
Figure 1. Thermopower of the thermocell systems. (A) GTCs with different molar concentrations of GdnHCl (x M-GTCs); (B) CTCs with different mass concentrations of CH (y mg mL-1-CTCs); (C) GCTCs with 50 mg mL-1 CH and different molar concentrations of GdnHCl (z M-GCTCs). Error bars represent the standard deviation of repeated measurements under the same experimental conditions. GTCs: GdnHCl-regulated thermocells; CTCs: CH-regulated thermocells; GCTCs: GdnHCl-CH-co-regulated thermocells.
Working mechanism of GCTCs
Upon observation, we noted that there were crystals forming at the top cold electrode (~293 K), which subsequently fell to the bottom hot electrode due to gravity and then dissolved gradually. As shown in Supplementary Figure 2, after the addition of GdnHCl, a slight shift was detected in the absorption peak of [Fe(CN)6]4- electrolyte in the UV-Vis spectra, while the one for [Fe(CN)6]3- remained unchanged with GdnHCl additive compared with those of pristine electrolyte. It reveals that the interaction induced by GdnHCl is specifically with [Fe(CN)6]4- rather than [Fe(CN)6]3- ions. This is attributed to the stronger chaotrope-chaotrope interaction between guanidine cations and [Fe(CN)6]4- than [Fe(CN)6]3- ions, and the [Fe(CN)6]4--related crystals have been confirmed to possess high thermosensitive solubility[25,26,31,32]. Additionally, we retrieved the precipitates accumulated at the hot electrode from GCTCs for X-ray powder diffraction characterization [Supplementary Figure 3]. The peaks of GdnHCl-induced crystals in GCTCs were consistent with those reported[26,31,32]. These results indicate that the precipitates are formed via the crystallization of [Fe(CN)6]4- ions induced by GdnHCl, and it is a new species different from [Fe(CN)6]4- and GdnHCl. Hence, the addition of GdnHCl can induce the crystallization of [Fe(CN)6]4- ions, thus regulating the [Fe(CN)6]4- concentration profile in GCTCs. A different result is presented in terms of adding CH into the [Fe(CN)6]3-/4- electrolyte. As illustrated in the UV-Vis spectra in Figure 2A, the characteristic absorption peak of [Fe(CN)6]4- electrolyte barely changed after CH was added. By contrast, the absorption peak for [Fe(CN)6]3- electrolyte exhibited no substantial change upon the initial addition of CH, but the characteristic peak of [Fe(CN)6]4- appeared and that of [Fe(CN)6]3- weakened significantly after the solution was heated at 343 K, confirming the interaction of CH with [Fe(CN)6]3- instead of [Fe(CN)6]4- ions occurs as temperature rises, which results in the generation of [Fe(CN)6]4-. CV analysis was further implemented to validate this chemical interaction between CH and [Fe(CN)6]3- ions. As shown in Supplementary Figure 4A, for the pristine electrolyte, as the scan approached the oxidation peak, the current was dictated by the diffusion of [Fe(CN)6]4- ions from the bulk electrolyte to the electrode where the oxidation reaction from [Fe(CN)6]4- to [Fe(CN)6]3- occurred. The diffusion layer, the solution volume containing oxidized [Fe(CN)6]3- at the electrode surface, kept growing and gradually slowed down the ionic transport of [Fe(CN)6]4- to the electrode. When the potential was scanned negatively, according to the Nernst equation, [Fe(CN)6]3- at the electrode surface was reduced back to [Fe(CN)6]4-. As given in Supplementary Figure 4B, no redox peaks were observed for aqueous CH itself within the scan potential window at varying temperatures. Supplementary Figure 4C-E illustrate the voltammetric responses of aqueous [Fe(CN)6]4- with the additives of sole CH, sole GdnHCl, and both GdnHCl and CH, respectively. It was obvious that, when CH was added into [Fe(CN)6]4- electrolyte, the reduction peak referred to the reduction of [Fe(CN)6]3- to [Fe(CN)6]4- was weakened, and the oxidation peak corresponding to the oxidation of [Fe(CN)6]4- to [Fe(CN)6]3- was strengthened with increasing temperatures. On the contrary, there was no evident change in the redox peaks in the CV curves after GdnHCl was solely introduced into [Fe(CN)6]4- electrolyte. The redox peaks in the electrolyte of [Fe(CN)6]4- with GdnHCl and CH showed an analogous trend to those for CH in

Figure 2. Working mechanism of the thermopower enhancement in GdnHCl-CH-co-regulated thermocells (GCTCs). (A) UV-Vis absorption spectra of [Fe(CN)6]4-, and [Fe(CN)6]3-, with 50 mg mL-1 CH as the additive at 293 K and 343 K, respectively; (B) 1H NMR spectra tracking the evolution of CH dissolved in D2O-based [Fe(CN)6]3- electrolyte upon heating at 343 K, and 1H NMR spectra of the solution of CDH in D2O-based [Fe(CN)6]4- electrolyte at 343 K over time; (C) Schematic operation mechanism of thermocells with the additives of GdnHCl and CH. UV-Vis: Ultraviolet-visible; NMR: nuclear magnetic resonance.
1H NMR spectroscopy (400 MHz, D2O) was employed to further reveal the underlying mechanism. Supplementary Figure 5A shows the 1H NMR spectra for a solution of CH dissolved in D2O. There were only two triplets with an intensity ratio of 1:1 at 3.16 ppm and 2.79 ppm observed. The peaks are attributed to the two groups of hydrogen atoms in two -CH2- adjacent to -SH and -NH3+, respectively[34]. Additionally, CH possesses relative thermal stability in aqueous solution during the specified period, as the peaks in the
Analogous to the interaction between [Fe(CN)6]3- and cysteine, we propose that there are two possible mechanistic pathways for the oxidation of CH to CDH [Supplementary Figure 6]. In route one, the deprotonation of CH occurs prior to the oxidation reaction, and then the corresponding radicals are generated[35,36]. The second route begins with direct oxidation of the protonated CH, generating a thiol radical cation intermediate that undergoes deprotonation to form a radical species, which produces CDH through the coupling process[37]. Both transformation routes of CH are believed to participate in the chemical interaction with [Fe(CN)6]3- ions. In other words, the oxidation of CH to CDH involves the initial generation of the thiyl radicals and the subsequent evolution into CDH as the product.
As depicted in Figure 2C, the chaotropic GdnHCl selectively induces the crystallization of [Fe(CN)6]4- at the cold electrode, resulting in a low concentration of [Fe(CN)6]4- at the cold side. Thus, the reduction reaction from [Fe(CN)6]3- to [Fe(CN)6]4- by obtaining one electron from the electrode is enhanced, and the local concentration of [Fe(CN)6]3- decreases as well. Then, driven by the gravity force, the crystals precipitate onto the bottom hot electrode, and redissolve at the hot electrode due to the thermosensitivity, resulting in a high concentration of [Fe(CN)6]4- at the hot side. With the release of [Fe(CN)6]4-, the oxidation reaction from [Fe(CN)6]4- to [Fe(CN)6]3- by transferring one electron to the electrode is enhanced, leading to an increasing local concentration of [Fe(CN)6]3-. The [Fe(CN)6]3--sensitive CH interacts with [Fe(CN)6]3- ions at the hot electrode, rendering the concentration of [Fe(CN)6]3- to reduce. The electrocatalytic reduction of [Fe(CN)6]3- back to [Fe(CN)6]4-, which can be reoxidized, increases the concentration of [Fe(CN)6]4- at the hot electrode simultaneously. When both additives, GdnHCl and CH, are introduced into the electrolyte, a low local concentration of [Fe(CN)6]4- near the cold side enhances the reduction reaction from [Fe(CN)6]3- to
With regard to the reaction between CH and [Fe(CN)6]3-, an excessive amount of CH in the electrolyte may lead to instant depletion of the redox ions, which is detrimental to the thermocell system, exhibiting the sharp decline of thermopower in CTCs with CH over 50 mg mL-1. In other words, for CH, a mass concentration of 50 mg mL-1 guarantees both the operation of the thermocells and the thermopower enhancement. Since CH at its optimal concentration exhibited only a slight improvement in the thermopower in CTCs compared to the enhancement effect induced via the two additives of GdnHCl and CH in GCTCs, we infer that the addition of GdnHCl in GCTCs not only contributes to the establishment of [Fe(CN)6]4- concentration gradient via the selective crystallization effect between two electrodes, but also facilitates the chemical regulation interaction of CH and [Fe(CN)6]3-, enhancing its reaction kinetics. Therefore, when CH is added into the pristine electrolyte alone, the co-existence of the redox couple impedes the reaction kinetics between CH and [Fe(CN)6]3-, thus the thermopower enhancement contributed by the chemical regulation effect is not fully manifested and the value is relatively low. Once GdnHCl is added together with CH, the crystallization of [Fe(CN)6]4- by GdnHCl leaves more [Fe(CN)6]3- to interact with CH in the liquid phase. Thus the chemical regulation effect between CH and [Fe(CN)6]3- is fully exerted. The two effects synergistically enhance the thermopower, generating a notably high thermopower. The electrolyte of [Fe(CN)6]3- with sole CH additive dissolved at 343 K is displayed in Supplementary Figure 7A, manifesting clear green color when CH directly interacts with [Fe(CN)6]3-. Supplementary Figure 7B-F presents the comparison of color evolution of the [Fe(CN)6]3-/4- electrolytes with both GdnHCl and CH additives (left) and with CH as the exclusive additive (right) over time. The left one with both GdnHCl and CH as the chemical additives also showed a clear green color similar to that of sole CH in [Fe(CN)6]3-, which provides direct visual evidence confirming that the addition of GdnHCl to induce the crystallization of [Fe(CN)6]4- allows CH to better interact with [Fe(CN)6]3-, synergistically regulating the concentration gradients of the redox couple.
Thermoelectric performance of GCTCs
Comprehensive analyses were performed in terms of the thermoelectric properties of GCTCs. We measured the electrical conductivity in the presence of varying temperature differences using EIS [Supplementary Figure 8]. It was found that no visible semicircles were detected in the Nyquist plots of the thermocell systems with/without the additives, which implies that, for both the pristine electrolyte and the electrolyte with two additives, the electron transfer processes between the redox ions and electrodes at the interfaces are rapid[38,39]. The resistance was obtained via the intersection point with the x-axis in the Nyquist plot. The non-isothermal electrical conductivity of 0.5 M-GCTC increased from 14 S m-1 to 25 S m-1 with elevated temperature differences from 0 K to 50 K, which showed a similar trend to that for the pristine thermocell without any additives. The thermal conductivity of 0.5 M-GCTC was obtained via the steady-state method

Figure 3. Thermoelectric performance of the thermocells. (A) Current density versus voltage output and corresponding power density of the pristine, 0.5 M-GTC, 50 mg mL-1-CTC, and 0.5 M-GCTC systems at a ΔT of 50 K; (B) Comparison of ηcr and Se values with various [Fe(CN)6]3-/4--based thermocell systems documented in the literature from perspectives of optimization toward electrolyte, electrode, and both electrolyte and electrode, respectively. A dashed line indicates the commercialization threshold of ~5% for thermocells [Supplementary Table 1]. GCTC: GdnHCl-CH-co-regulated thermocell; GTC: GdnHCl-regulated thermocell; CTC:
In the aforementioned analyses, the thermocells were placed in a cold-over-hot mode; that is, the electrode on the top of the thermocells was maintained at 293 K, while the bottom electrode was subjected to increasing temperatures with each step of 10 K until reaching 343 K. However, in practical scenarios, the temperature gradient does not consistently exhibit a unidirectional pattern. For example, the ground temperature is typically higher than the air temperature during sunny daytime, whereas the temperature profile reverses during the night period. Supplementary Figure 11 illustrates the thermopower of
Demonstration of integrated GCTC module
A prototype module (size: 185 mm × 70 mm × 15 mm) comprising 20 0.5 M-GCTC units connected in series was designed, as presented in Figure 4A. The as-fabricated module in the cold-over-hot orientation generated an Voc of 4.11 V, a short-circuit current (Isc) of 21.42 mA, and a corresponding Pmax of 25.73 mW when subjected to a ΔT of 50 K as illustrated in Figure 4B and C. In Figure 4D-F, we demonstrated that our GCTC module was capable of directly powering a series of electronic devices, including an electrochromic smart window, a green light-emitting diode (LED) light and a thermohydrometer [Supplementary Movie 1]. By placing the module in the hot-over-cold mode, a Voc of 3.12 V was generated [Supplementary Figure 14], proving the feasibility of GCTCs for non-unidirectional heat flows. If only the cold-over-hot cell orientation is evaluated in practical scenarios, because of the high thermopower value, we believe that a module consisting of

Figure 4. Demonstration of GCTC powering electronic devices. (A) Photographs of a GCTC module containing 20 units of 0.5 M-GCTCs connected in series and the setup for electricity generation; (B) Real-time voltage of the GCTC module under a ΔT of 50 K; (C)
CONCLUSIONS
In summary, a GCTC was prepared by introducing GdnHCl and CH into the 0.4 M [Fe(CN)6]3-/4- electrolyte. This strategy, utilizing only small amounts of these two ionic additives, enhances thermopower without compromising electrical conductivity, and is adaptable to different cell orientations. The mechanism was investigated, revealing that thermopower improvement is achieved by regulating the concentration gradients of redox ions between the electrodes based on the thermosensitive crystallization effect of GdnHCl on [Fe(CN)6]4- and the chemical regulation effect of CH on [Fe(CN)6]3-. The interaction between GdnHCl and [Fe(CN)6]4- also contributes to the reaction kinetics of CH and [Fe(CN)6]3-, synergistically boosting the thermopower. With low concentrations of the ionic additives, a high thermopower of 4.34 mV K-1 was achieved with a satisfactory ηcr of 5.50% in the cold-over-hot 0.5 M-GCTC, which could maintain a relatively high value of 3.27 mV K-1 when the orientation was reversed. While only considering the cold-over-hot arrangement, the synergistic enhancement could make the performance reach a much higher level of 9.06 mV K-1 with a ηcr of 12.65% in 3.0 M-GCTC containing a high concentration of GdnHCl. The practical viability was demonstrated via an integrated module with
Our work developing the GCTCs aims to provide a new design route for thermocells to improve their thermoelectric performance. Further optimization in the performance of the GCTCs might be achieved by improvement of the reversibility of the interaction between CH and [Fe(CN)6]3- via catalysts, modification of the electrode material to improve the current density, adoption of a thermal separator to decrease the thermal conductivity, etc.[44,52,53].
DECLARATIONS
Acknowledgments
The authors would like to acknowledge Dr. Wei-Ting Wang for the design of the thermocell and express their appreciation to Dr. Xun Wang for her assistance in the design and establishment of the thermopower measurement setup.
Authors’ contributions
Devised the idea, designed the experiment, interpreted the data, and prepared the manuscript: Mu, Y.;
Designed the integrated thermocell module: Mu, Y.; Mu, K.
Performed the experiments and processed the data: Mu, Y.
Conducted the 1H NMR characterization: Mu, Y.; Li, K.; Peng, Y. K.
Availability of data and materials
The data supporting our findings can be found in the Supplementary Materials.
Financial support and sponsorship
This work was supported by financial support from the General Research Fund (17203520, 17207422) and Collaborative Research Fund (C7082-21G, C6016-22G) from the Research Grants Council of the Hong Kong Special Administrative Region and the Startup Grant of the City University of Hong Kong.
Conflicts of interest
All authors declared that there are no conflicts of interest.
Ethical approval and consent to participate
Not applicable.
Consent for publication
Not applicable.
Copyright
© The Author(s) 2025.
Supplementary Materials
REFERENCES
1. Chu, S.; Majumdar, A. Opportunities and challenges for a sustainable energy future. Nature 2012, 488, 294-303.
2. Gur, I.; Sawyer, K.; Prasher, R. Searching for a better thermal battery. Science 2012, 335, 1454-5.
3. Gemma, A.; Gotsmann, B. A roadmap for molecular thermoelectricity. Nat. Nanotechnol. 2021, 16, 1299-301.
4. He, P.; Jang, J.; Kang, H.; Yoon, H. J. Thermoelectricity in molecular tunnel junctions. Chem. Rev. 2025, 125, 2953-3004.
5. Reddy, P.; Jang, S. Y.; Segalman, R. A.; Majumdar, A. Thermoelectricity in molecular junctions. Science 2007, 315, 1568-71.
6. Leblanc, S.; Yee, S. K.; Scullin, M. L.; Dames, C.; Goodson, K. E. Material and manufacturing cost considerations for thermoelectrics. Renew.. Sustain. Energy. Rev. 2014, 32, 313-27.
7. Hao, F.; Qiu, P.; Tang, Y.; et al. High efficiency Bi2Te3-based materials and devices for thermoelectric power generation between 100 and 300 °C. Energy. Environ. Sci. 2016, 9, 3120-7.
8. Zhu, B.; Liu, X.; Wang, Q.; et al. Realizing record high performance in n-type Bi2Te3-based thermoelectric materials. Energy. Environ. Sci. 2020, 13, 2106-14.
9. Zheng, Z.; Shi, X.; Ao, D.; et al. Harvesting waste heat with flexible Bi2Te3 thermoelectric thin film. Nat. Sustain. 2023, 6, 180-91.
10. Chen, Y. X.; Shi, X. L.; Zhang, J. Z.; et al. Deviceization of high-performance and flexible Ag2Se films for electronic skin and servo rotation angle control. Nat. Commun. 2024, 15, 8356.
11. Yang, D.; Shi, X. L.; Li, M.; et al. Flexible power generators by Ag2Se thin films with record-high thermoelectric performance. Nat. Commun. 2024, 15, 923.
12. Dupont, M. F.; MacFarlane, D. R.; Pringle, J. M. Thermo-electrochemical cells for waste heat harvesting - progress and perspectives. Chem. Commun. 2017, 53, 6288-302.
13. Jiao, N.; Abraham, T. J.; Macfarlane, D. R.; Pringle, J. M. Ionic liquid electrolytes for thermal energy harvesting using a cobalt redox couple. J. Electrochem. Soc. 2014, 161, D3061-5.
14. Sun, S.; Li, M.; Shi, X.; Chen, Z. Advances in ionic thermoelectrics: from materials to devices. Adv. Energy. Mater. 2023, 13, 2203692.
15. Lu, X.; Mo, Z.; Liu, Z.; et al. Robust, efficient, and recoverable thermocells with zwitterion-boosted hydrogel electrolytes for energy-autonomous and wearable sensing. Angew. Chem. Int. Ed. 2024, 63, 202405357.
16. Ding, Z.; Du, C.; Long, W.; et al. Thermoelectrics and thermocells for fire warning applications. Sci. Bull. 2023, 68, 3261-77.
17. Wang, H.; Zhuang, X.; Xie, W.; et al. Thermosensitive-CsI3-crystal-driven high-power I-/I3- thermocells. Cell. Rep. Phys. Sci. 2022, 3, 100737.
18. Yu, B.; Xiao, H.; Zeng, Y.; et al. Cost-effective n-type thermocells enabled by thermosensitive crystallizations and 3D multi-structured electrodes. Nano. Energy. 2022, 93, 106795.
19. Abraham, T. J.; Macfarlane, D. R.; Pringle, J. M. High Seebeck coefficient redox ionic liquid electrolytes for thermal energy harvesting. Energy. Environ. Sci. 2013, 6, 2639-45.
20. Zinovyeva, V.; Nakamae, S.; Bonetti, M.; Roger, M. Enhanced thermoelectric power in ionic liquids. ChemElectroChem 2014, 1, 426-30.
21. Anari, E. H.; Romano, M.; Teh, W. X.; et al. Substituted ferrocenes and iodine as synergistic thermoelectrochemical heat harvesting redox couples in ionic liquids. Chem. Commun. 2016, 52, 745-8.
22. Lazar, M. A.; Al-Masri, D.; MacFarlane, D. R.; Pringle, J. M. Enhanced thermal energy harvesting performance of a cobalt redox couple in ionic liquid-solvent mixtures. Phys. Chem. Chem. Phys. 2016, 18, 1404-10.
23. Zhou, H.; Yamada, T.; Kimizuka, N. Supramolecular Thermo-electrochemical cells: enhanced thermoelectric performance by host-guest complexation and salt-induced crystallization. J. Am. Chem. Soc. 2016, 138, 10502-7.
24. Kim, T.; Lee, J. S.; Lee, G.; et al. High thermopower of ferri/ferrocyanide redox couple in organic-water solutions. Nano. Energy. 2017, 31, 160-7.
25. Duan, J.; Feng, G.; Yu, B.; et al. Aqueous thermogalvanic cells with a high Seebeck coefficient for low-grade heat harvest. Nat. Commun. 2018, 9, 5146.
26. Yu, B.; Duan, J.; Cong, H.; et al. Thermosensitive crystallization-boosted liquid thermocells for low-grade heat harvesting. Science 2020, 370, 342-6.
27. Wang, Y.; Zhang, Y.; Xin, X.; et al. In situ photocatalytically enhanced thermogalvanic cells for electricity and hydrogen production. Science 2023, 381, 291-6.
28. Yu, B.; Yang, W.; Li, J.; et al. Heat-triggered high-performance thermocells enable a self-powered forest fire alarm. J. Mater. Chem. A. 2021, 9, 26119-26.
29. Kraemer, D.; Chen, G. A simple differential steady-state method to measure the thermal conductivity of solid bulk materials with high accuracy. Rev. Sci. Instrum. 2014, 85, 025108.
30. Jannot, Y.; Degiovanni, A. Steady-state methods. In Thermal Properties Measurement of Materials, 1st ed.; ISTE Ltd and John Wiley & Sons, Inc., 2018; pp 83-116.
31. Zhang, D.; Mao, Y.; Ye, F.; et al. Stretchable thermogalvanic hydrogel thermocell with record-high specific output power density enabled by ion-induced crystallization. Energy. Environ. Sci. 2022, 15, 2974-82.
32. Liu, L.; Zhang, D.; Bai, P.; et al. Strong tough thermogalvanic hydrogel thermocell with extraordinarily high thermoelectric performance. Adv. Mater. 2023, 35, e2300696.
33. Elgrishi, N.; Rountree, K. J.; Mccarthy, B. D.; Rountree, E. S.; Eisenhart, T. T.; Dempsey, J. L. A practical beginner’s guide to cyclic voltammetry. J. Chem. Educ. 2018, 95, 197-206.
34. Cui, Y.; Tan, S.; Luo, Z.; et al. Synthesis of cysteamine hydrochloride by high pressure acidolysis of 2-mercaptothiazoline. Asian. J. Chem. 2010, 22, 3221-7. https://asianpubs.org/index.php/ajchem/article/view/11535 (accessed 2025-06-12).
35. Dénès, F.; Pichowicz, M.; Povie, G.; Renaud, P. Thiyl radicals in organic synthesis. Chem. Rev. 2014, 114, 2587-693.
36. Paulsen, C. E.; Carroll, K. S. Cysteine-mediated redox signaling: chemistry, biology, and tools for discovery. Chem. Rev. 2013, 113, 4633-79.
37. Nekrassova, O.; Allen, G.; Lawrence, N.; Jiang, L.; Jones, T.; Compton, R. The oxidation of cysteine by aqueous ferricyanide: a kinetic study using boron doped diamond electrode voltammetry. Electroanalysis , 14, 1464-9.
38. Romano, M. S.; Li, N.; Antiohos, D.; et al. Carbon nanotube - reduced graphene oxide composites for thermal energy harvesting applications. Adv. Mater. 2013, 25, 6602-6.
39. Laschuk, N. O.; Easton, E. B.; Zenkina, O. V. Reducing the resistance for the use of electrochemical impedance spectroscopy analysis in materials chemistry. RSC. Adv. 2021, 11, 27925-36.
40. Quickenden, T. I.; Mua, Y. A Review of power generation in aqueous thermogalvanic cells. J. Electrochem. Soc. 1995, 142, 3985.
41. Hu, R.; Cola, B. A.; Haram, N.; et al. Harvesting waste thermal energy using a carbon-nanotube-based thermo-electrochemical cell. Nano. Lett. 2010, 10, 838-46.
42. Im, H.; Kim, T.; Song, H.; et al. High-efficiency electrochemical thermal energy harvester using carbon nanotube aerogel sheet electrodes. Nat. Commun. 2016, 7, 10600.
43. Qian, W.; Cao, M.; Xie, F.; Dong, C. Thermo-electrochemical cells based on carbon nanotube electrodes by electrophoretic deposition. Nano-Micro. Lett. 2016, 8, 240-6.
44. Zhang, L.; Kim, T.; Li, N.; et al. High power density electrochemical thermocells for inexpensively harvesting low-grade thermal energy. Adv. Mater. 2017, 29, 1605652.
45. Li, G.; Dong, D.; Hong, G.; Yan, L.; Zhang, X.; Song, W. High-Efficiency cryo-thermocells assembled with anisotropic holey graphene aerogel electrodes and a eutectic redox electrolyte. Adv. Mater. 2019, 31, 1901403.
46. Zhao, L. D.; Lo, S. H.; Zhang, Y.; et al. Ultralow thermal conductivity and high thermoelectric figure of merit in SnSe crystals. Nature 2014, 508, 373-7.
47. Burkov, A. T.; Fedotov, A. I.; Novikov, S. V. Methods and apparatus for measuring thermopower and electrical conductivity of thermoelectric materials at high temperatures. In Thermoelectrics for power generation - a look at trends in the technology; Skipidarov, S.; Nikitin, M.; Eds.; InTech, 2016; pp 351-87.
48. Wang, H.; Chu, W.; Chen, G. A brief review on measuring methods of thermal conductivity of organic and hybrid thermoelectric materials. Adv. Elect. Mater. 2019, 5, 1900167.
49. Wei, T.; Guan, M.; Yu, J.; Zhu, T.; Chen, L.; Shi, X. How to measure thermoelectric properties reliably. Joule 2018, 2, 2183-8.
50. Jiang, L.; Kirihara, K.; Nandal, V.; et al. Thermoelectrochemical cells based on ferricyanide/ferrocyanide/guanidinium: application and challenges. ACS. Appl. Mater. Interfaces. , 2022, 22921-8.
51. Zhou, H.; Inoue, H.; Ujita, M.; Yamada, T. Advancement of electrochemical thermoelectric conversion with molecular technology. Angew. Chem. Int. Ed. 2023, 62, e202213449.
52. Wang, W. T.; Holzhey, P.; Zhou, N.; et al. Water- and heat-activated dynamic passivation for perovskite photovoltaics. Nature 2024, 632, 294-300.
Cite This Article
How to Cite
Download Citation
Export Citation File:
Type of Import
Tips on Downloading Citation
Citation Manager File Format
Type of Import
Direct Import: When the Direct Import option is selected (the default state), a dialogue box will give you the option to Save or Open the downloaded citation data. Choosing Open will either launch your citation manager or give you a choice of applications with which to use the metadata. The Save option saves the file locally for later use.
Indirect Import: When the Indirect Import option is selected, the metadata is displayed and may be copied and pasted as needed.
About This Article
Copyright

Data & Comments
Data
0


Comments
Comments must be written in English. Spam, offensive content, impersonation, and private information will not be permitted. If any comment is reported and identified as inappropriate content by OAE staff, the comment will be removed without notice. If you have any queries or need any help, please contact us at [email protected].