


fig3
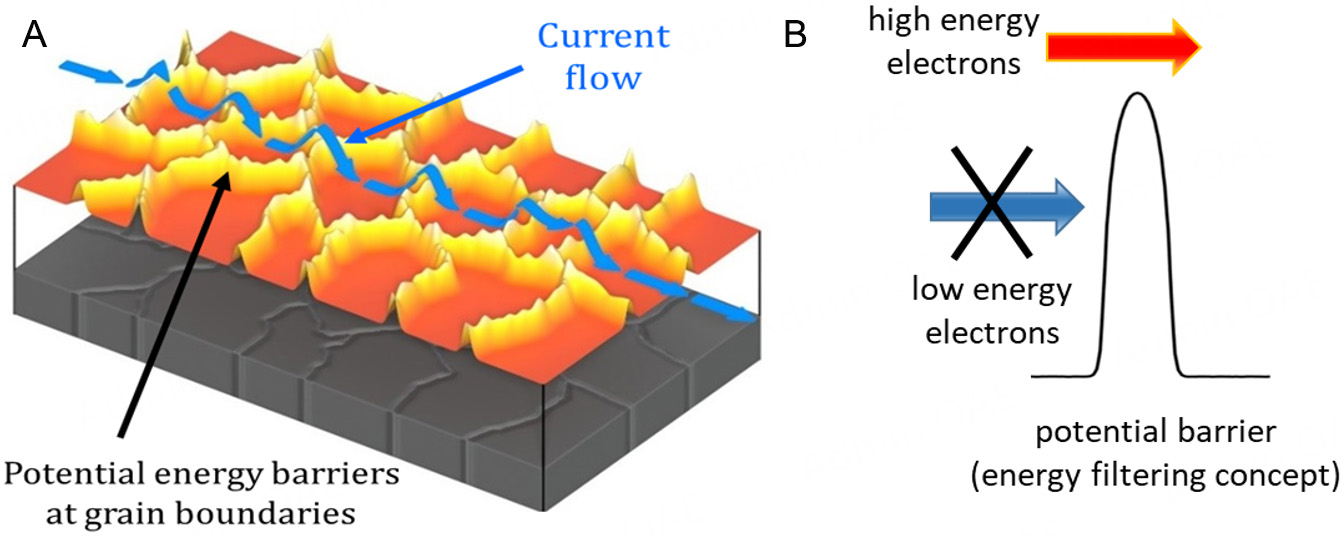
Figure 3. (A) An illustration of the effect of energy filtering at the grain boundaries of a nanocrystalline material. The vertical elevations are a plot of the energy level diagram at the interfaces that the electrons will find, to visually explain the energy filtering process and the potential energy barriers (in yellow) at the grain boundaries, which act as filtering barriers for high-energy electrons. The energy of the current flow (blue arrows) increases locally near the barriers (electrons absorb phonons and gain energy to overpass them) which locally increases the Seebeck coefficient. (B) A schematic of high-energy electrons passing through a grain boundary (potential barrier), where only carriers with energy greater than the barrier height can pass through, while the rest are blocked.


