


fig13
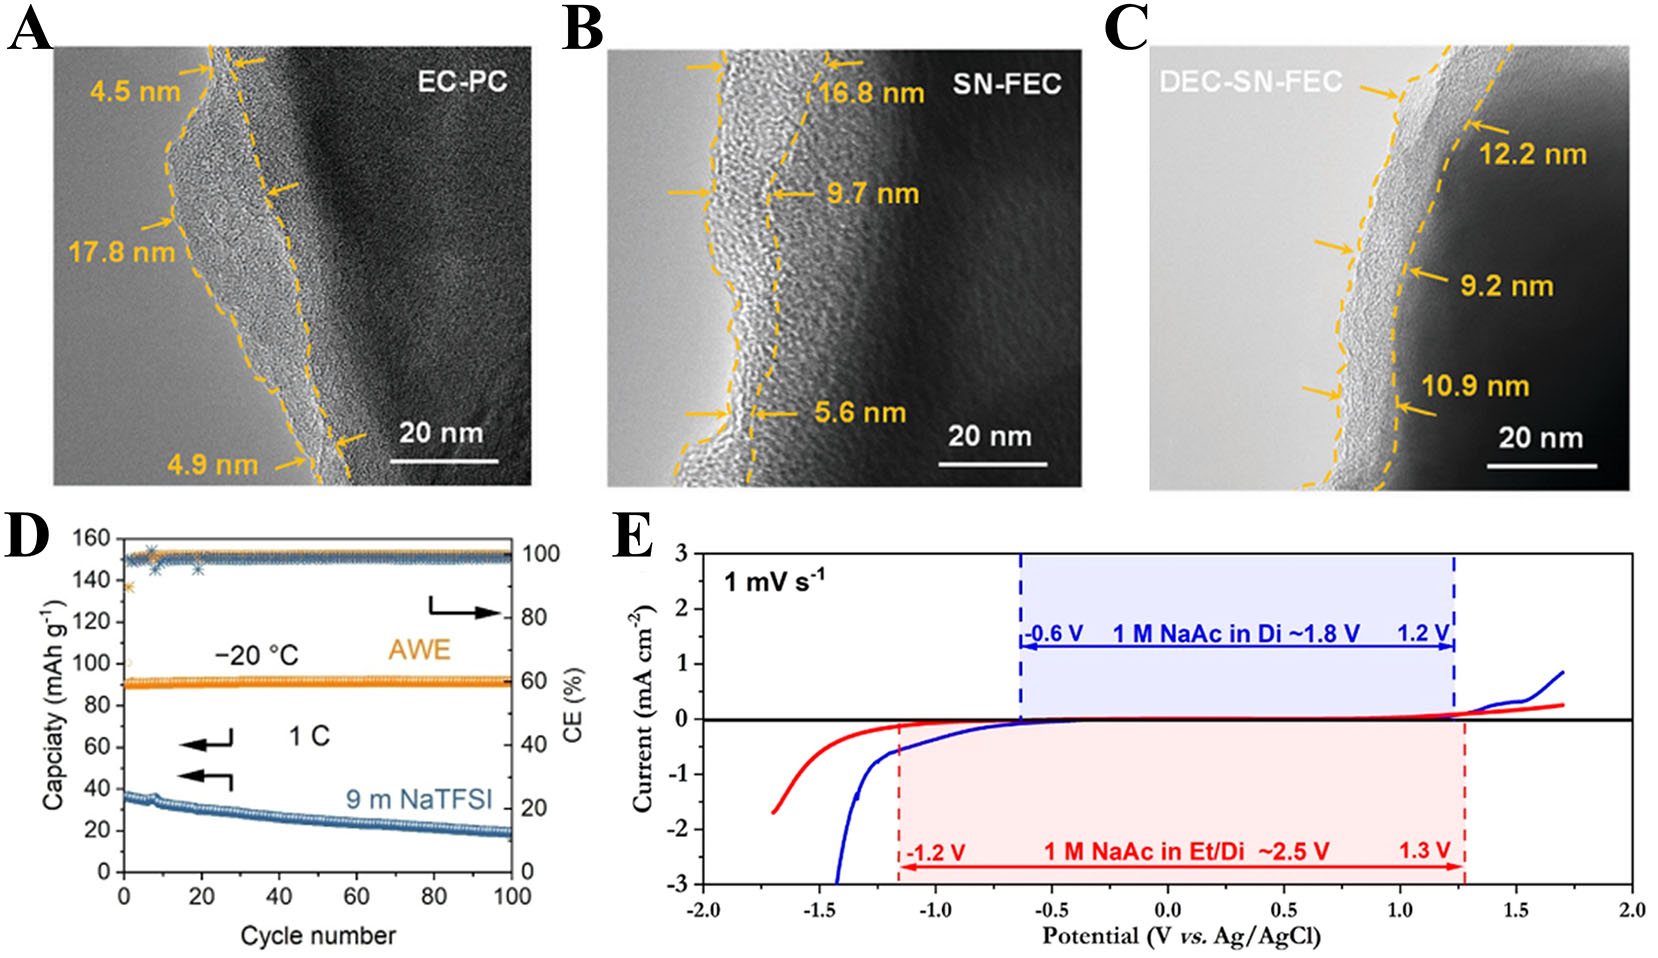
Figure 13. (A-C) HR-TEM images showing the CEI layer formed in EC-PC (A), SN-FEC (B), and DEC-SN-FEC (C) electrolytes. (A-C) Figures reprinted with permission from Ref.[153]. Copyright 2024 Wiley-VCH. (D) Discharge capacity of NVP/NTP using AWE in LT region. Reprinted with permission from Ref.[155]. Copyright 2024 Wiley-VCH. (E) Electrochemical performances of the Na0.44MnO2 plates in different electrolytes at different temperatures. Reprinted with permission from Ref.[156]. Copyright 2023 The American Chemical Society.


