


fig12
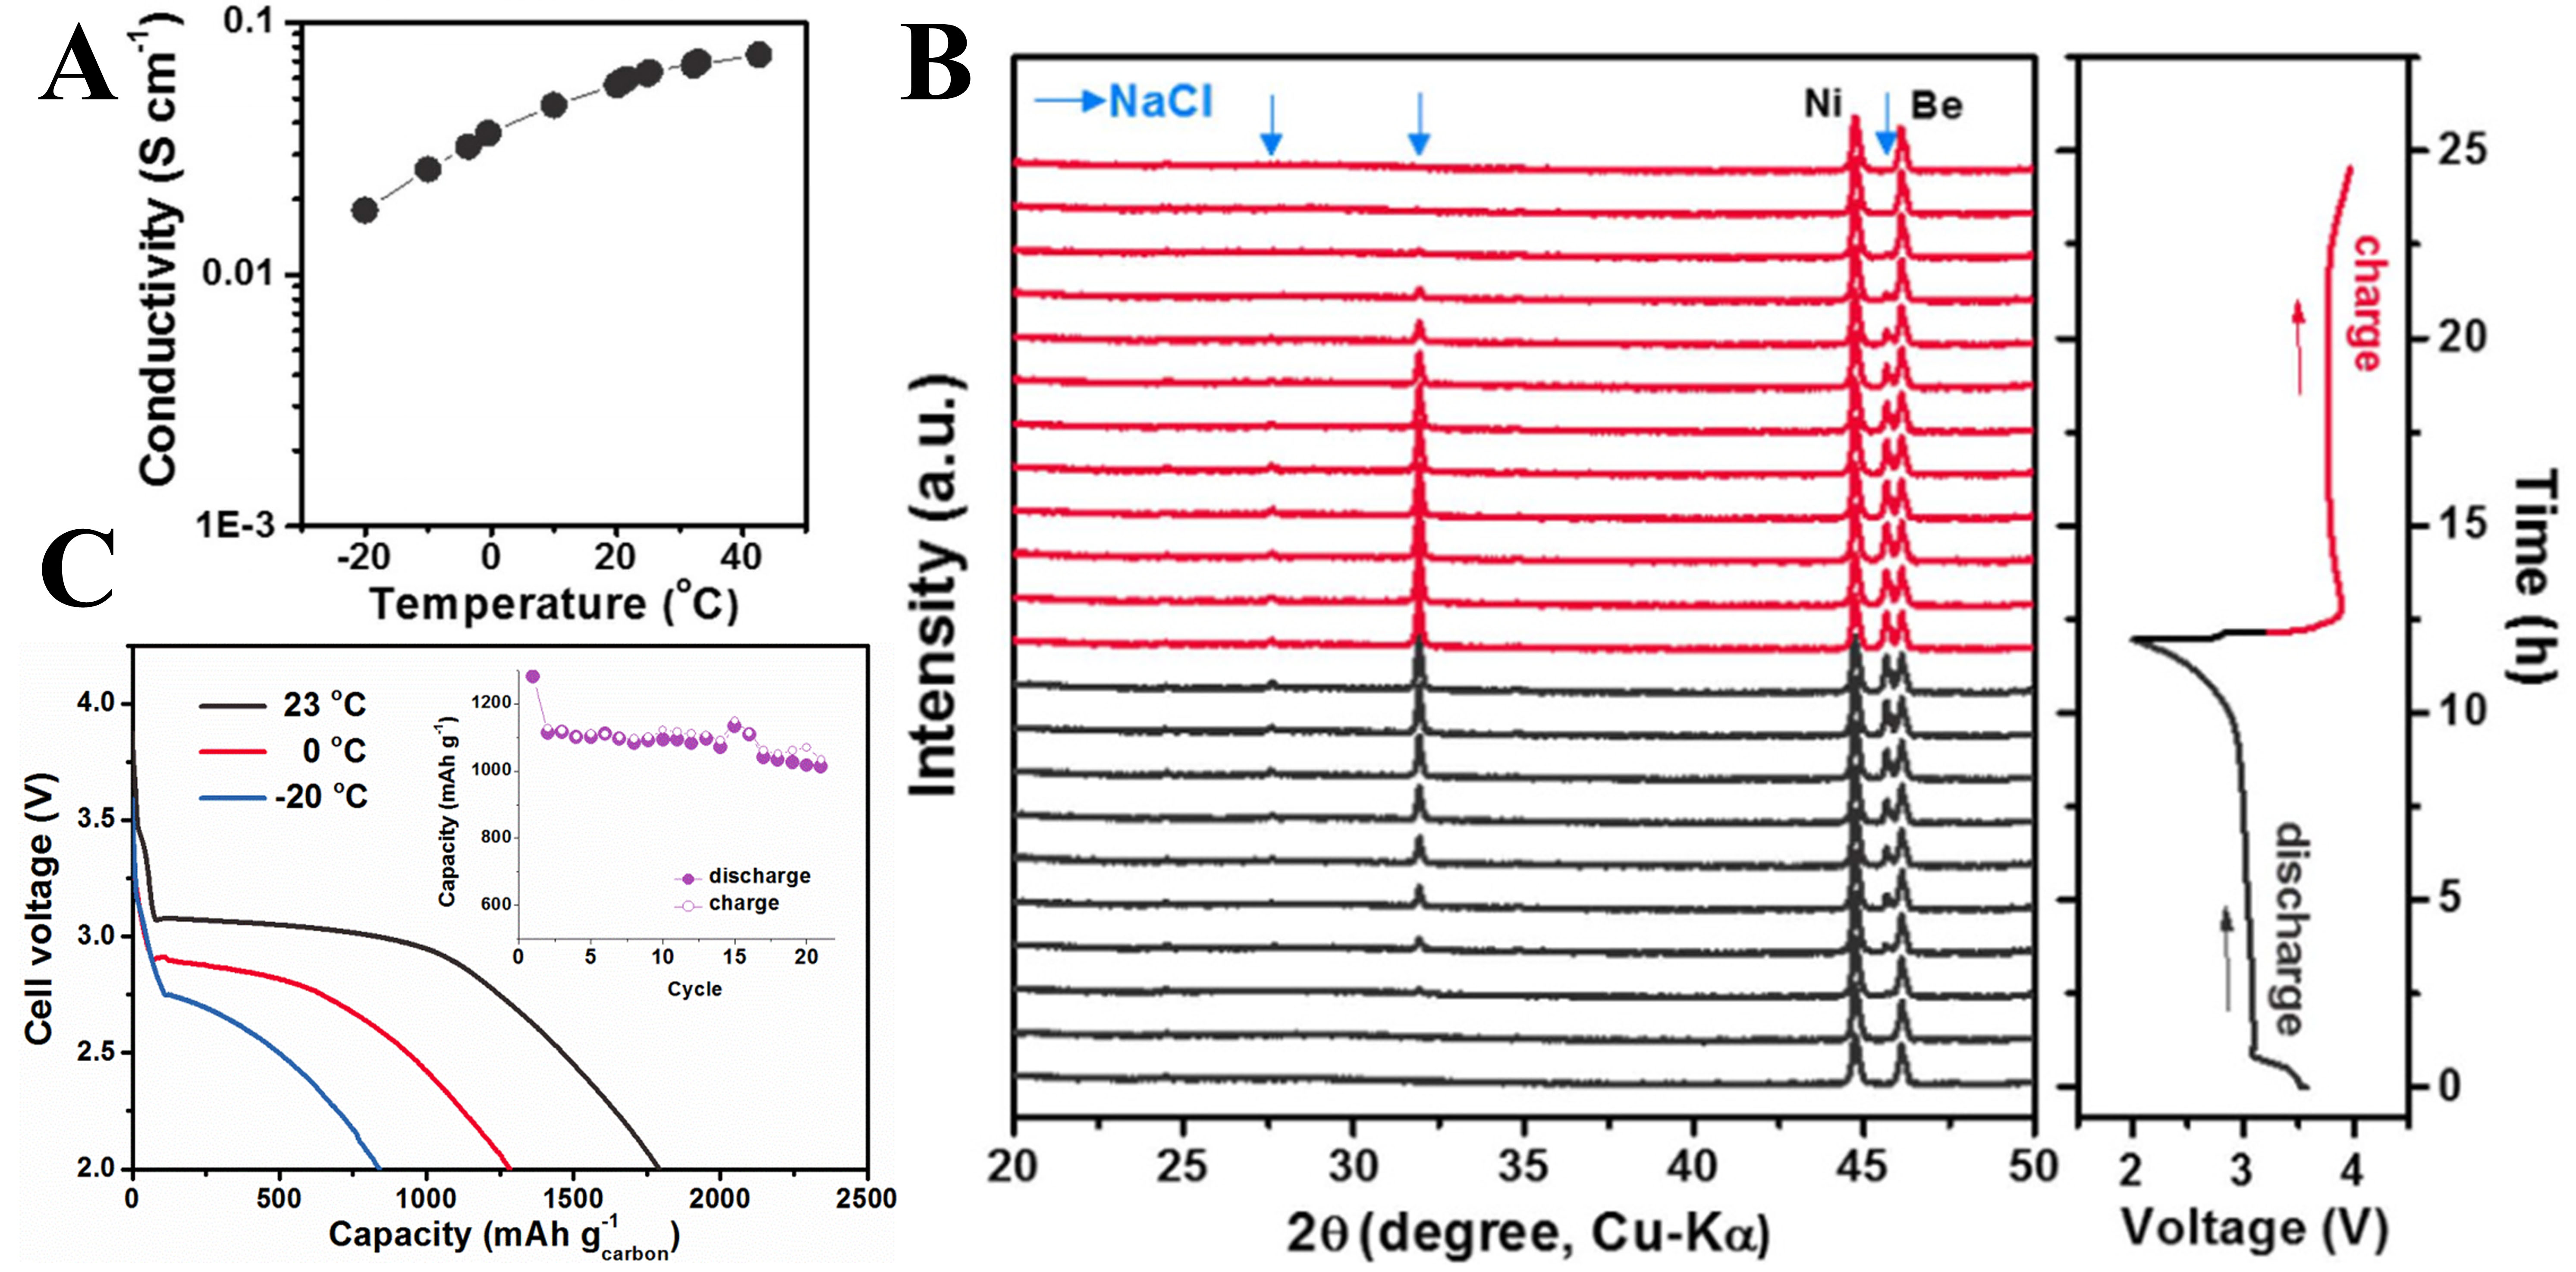
Figure 12. (A) Conductivity of NaAlCl4·2SO2 at various temperatures. (B) In situ XRD patterns of the carbon cathode in a Na-SO2 cell during the first cycle. (C) Discharge voltage profiles at various LT. (A-C) Figures reprinted with permission from Ref.[149]. Copyright 2015 Nature.


