


fig10
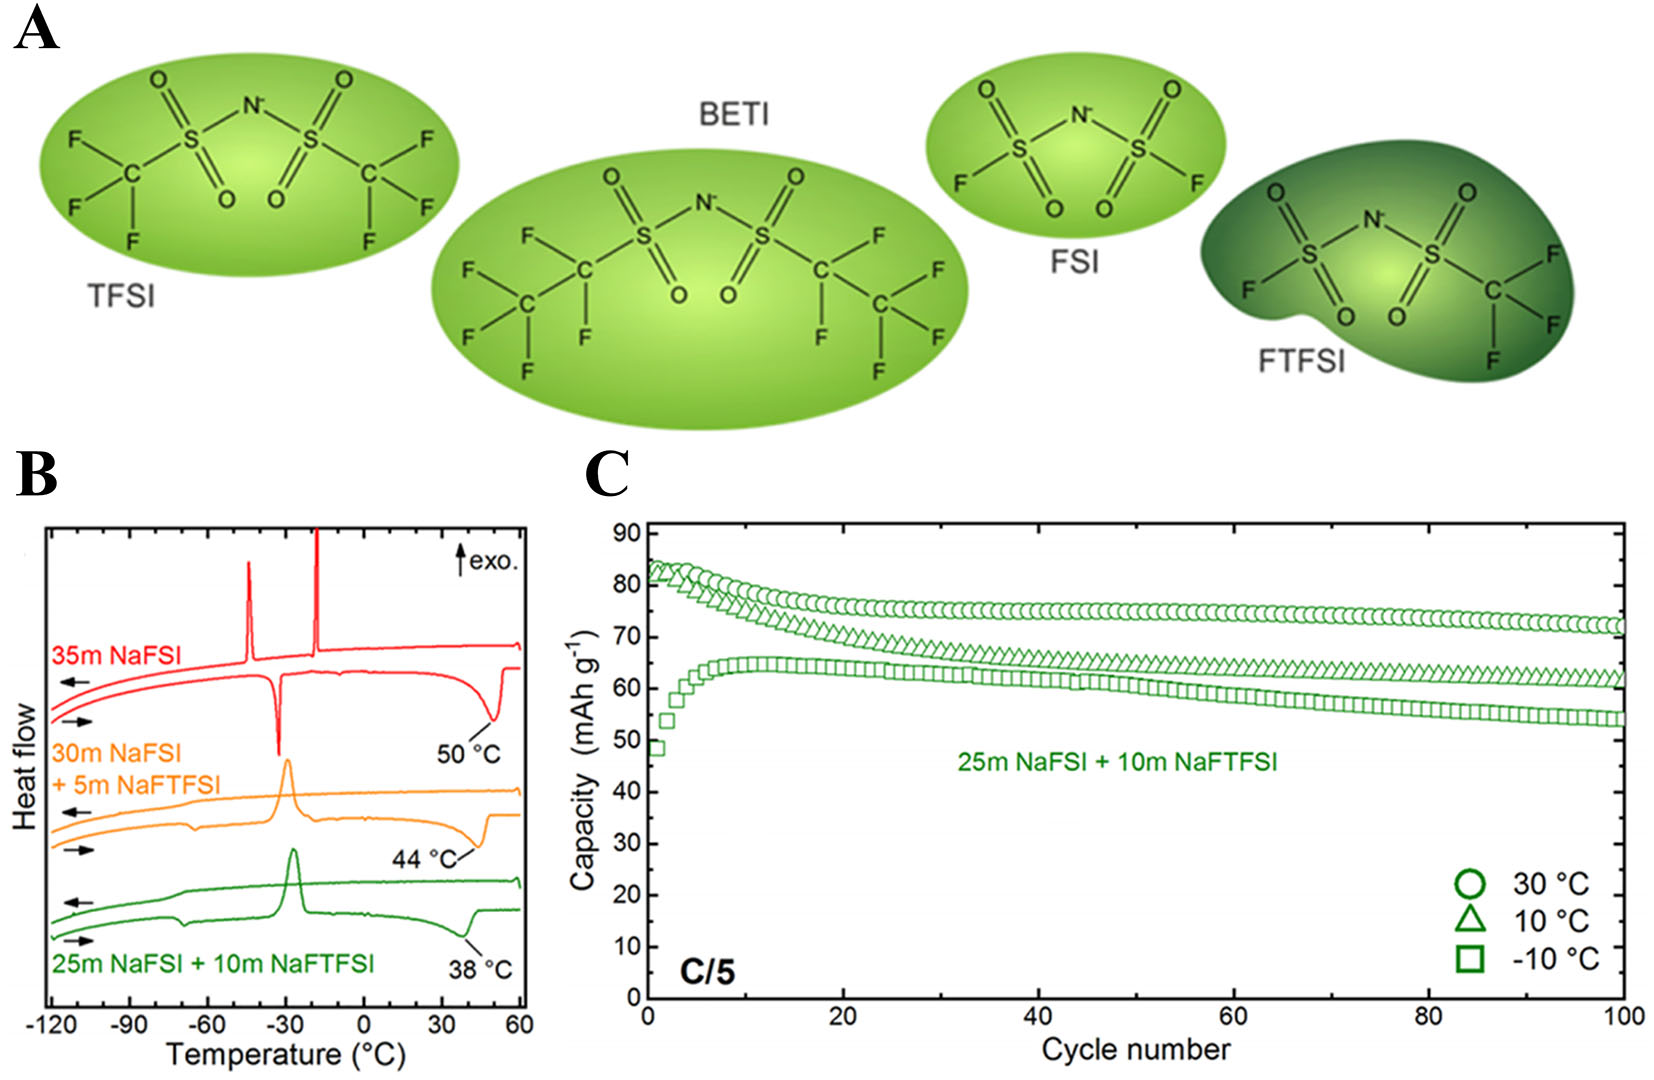
Figure 10. (A) Structural formulas of the symmetric and asymmetric anions. (B) DSC curves of 35 M NaFSI and mixed FSI/FTFSI electrolytes. (C) Discharge capacity of cells containing 25 M NaFSI + 10 M Na FTFSI operated at 30, 10, and -10 °C. (A-C) Figures reprinted with permission from Ref.[144]. Copyright 2019 The American Chemical Society.


