


fig3
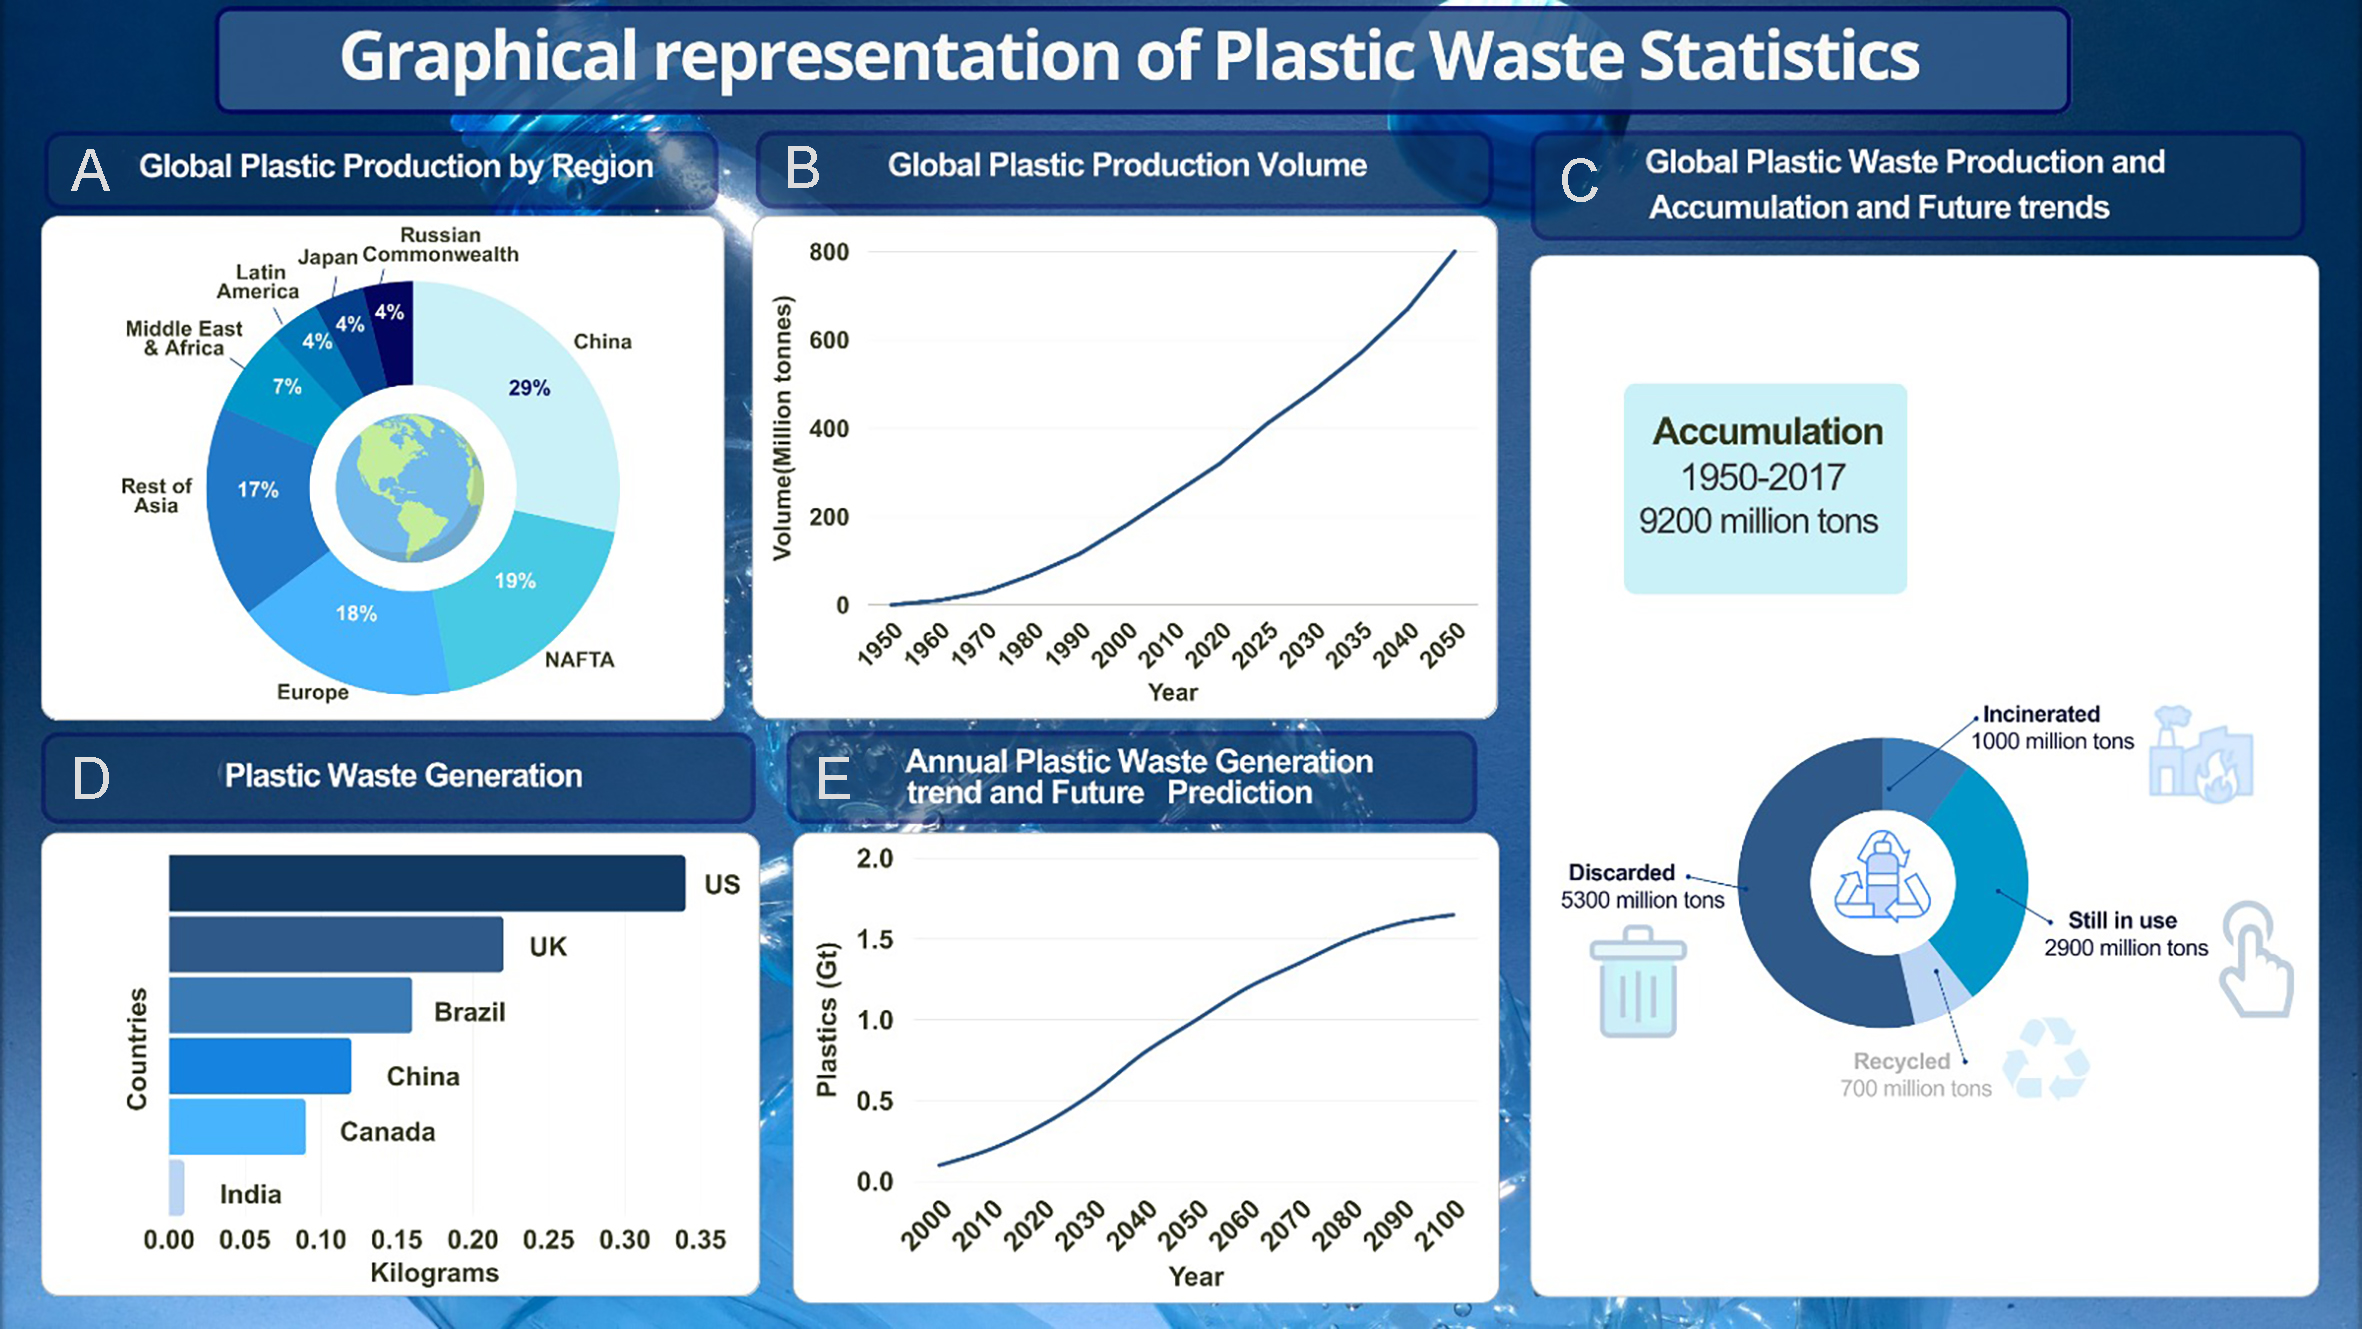
Figure 3. Global plastic waste generation and management trends (A) Plastic production by region: China leads with 29%, followed by NAFTA (19%) and Europe (18%). (B) Global plastic production (1950-2050): Steady growth projected to exceed 600 Mt by 2050. Data taken from[1]. (C) Plastic waste accumulation (1950-2017): Out of 9200 Mt, only 9% recycled, 11% incinerated, and 58% discarded data taken from[45]. (D) Country-wise waste generation: The US generates the highest per capita plastic waste (~0.34 kg/person), data taken from[1]. (E) Annual plastic waste prediction (2000-2100): Projected data to reach ~2 Gt/year by 2100, taken from[46].


