


fig2
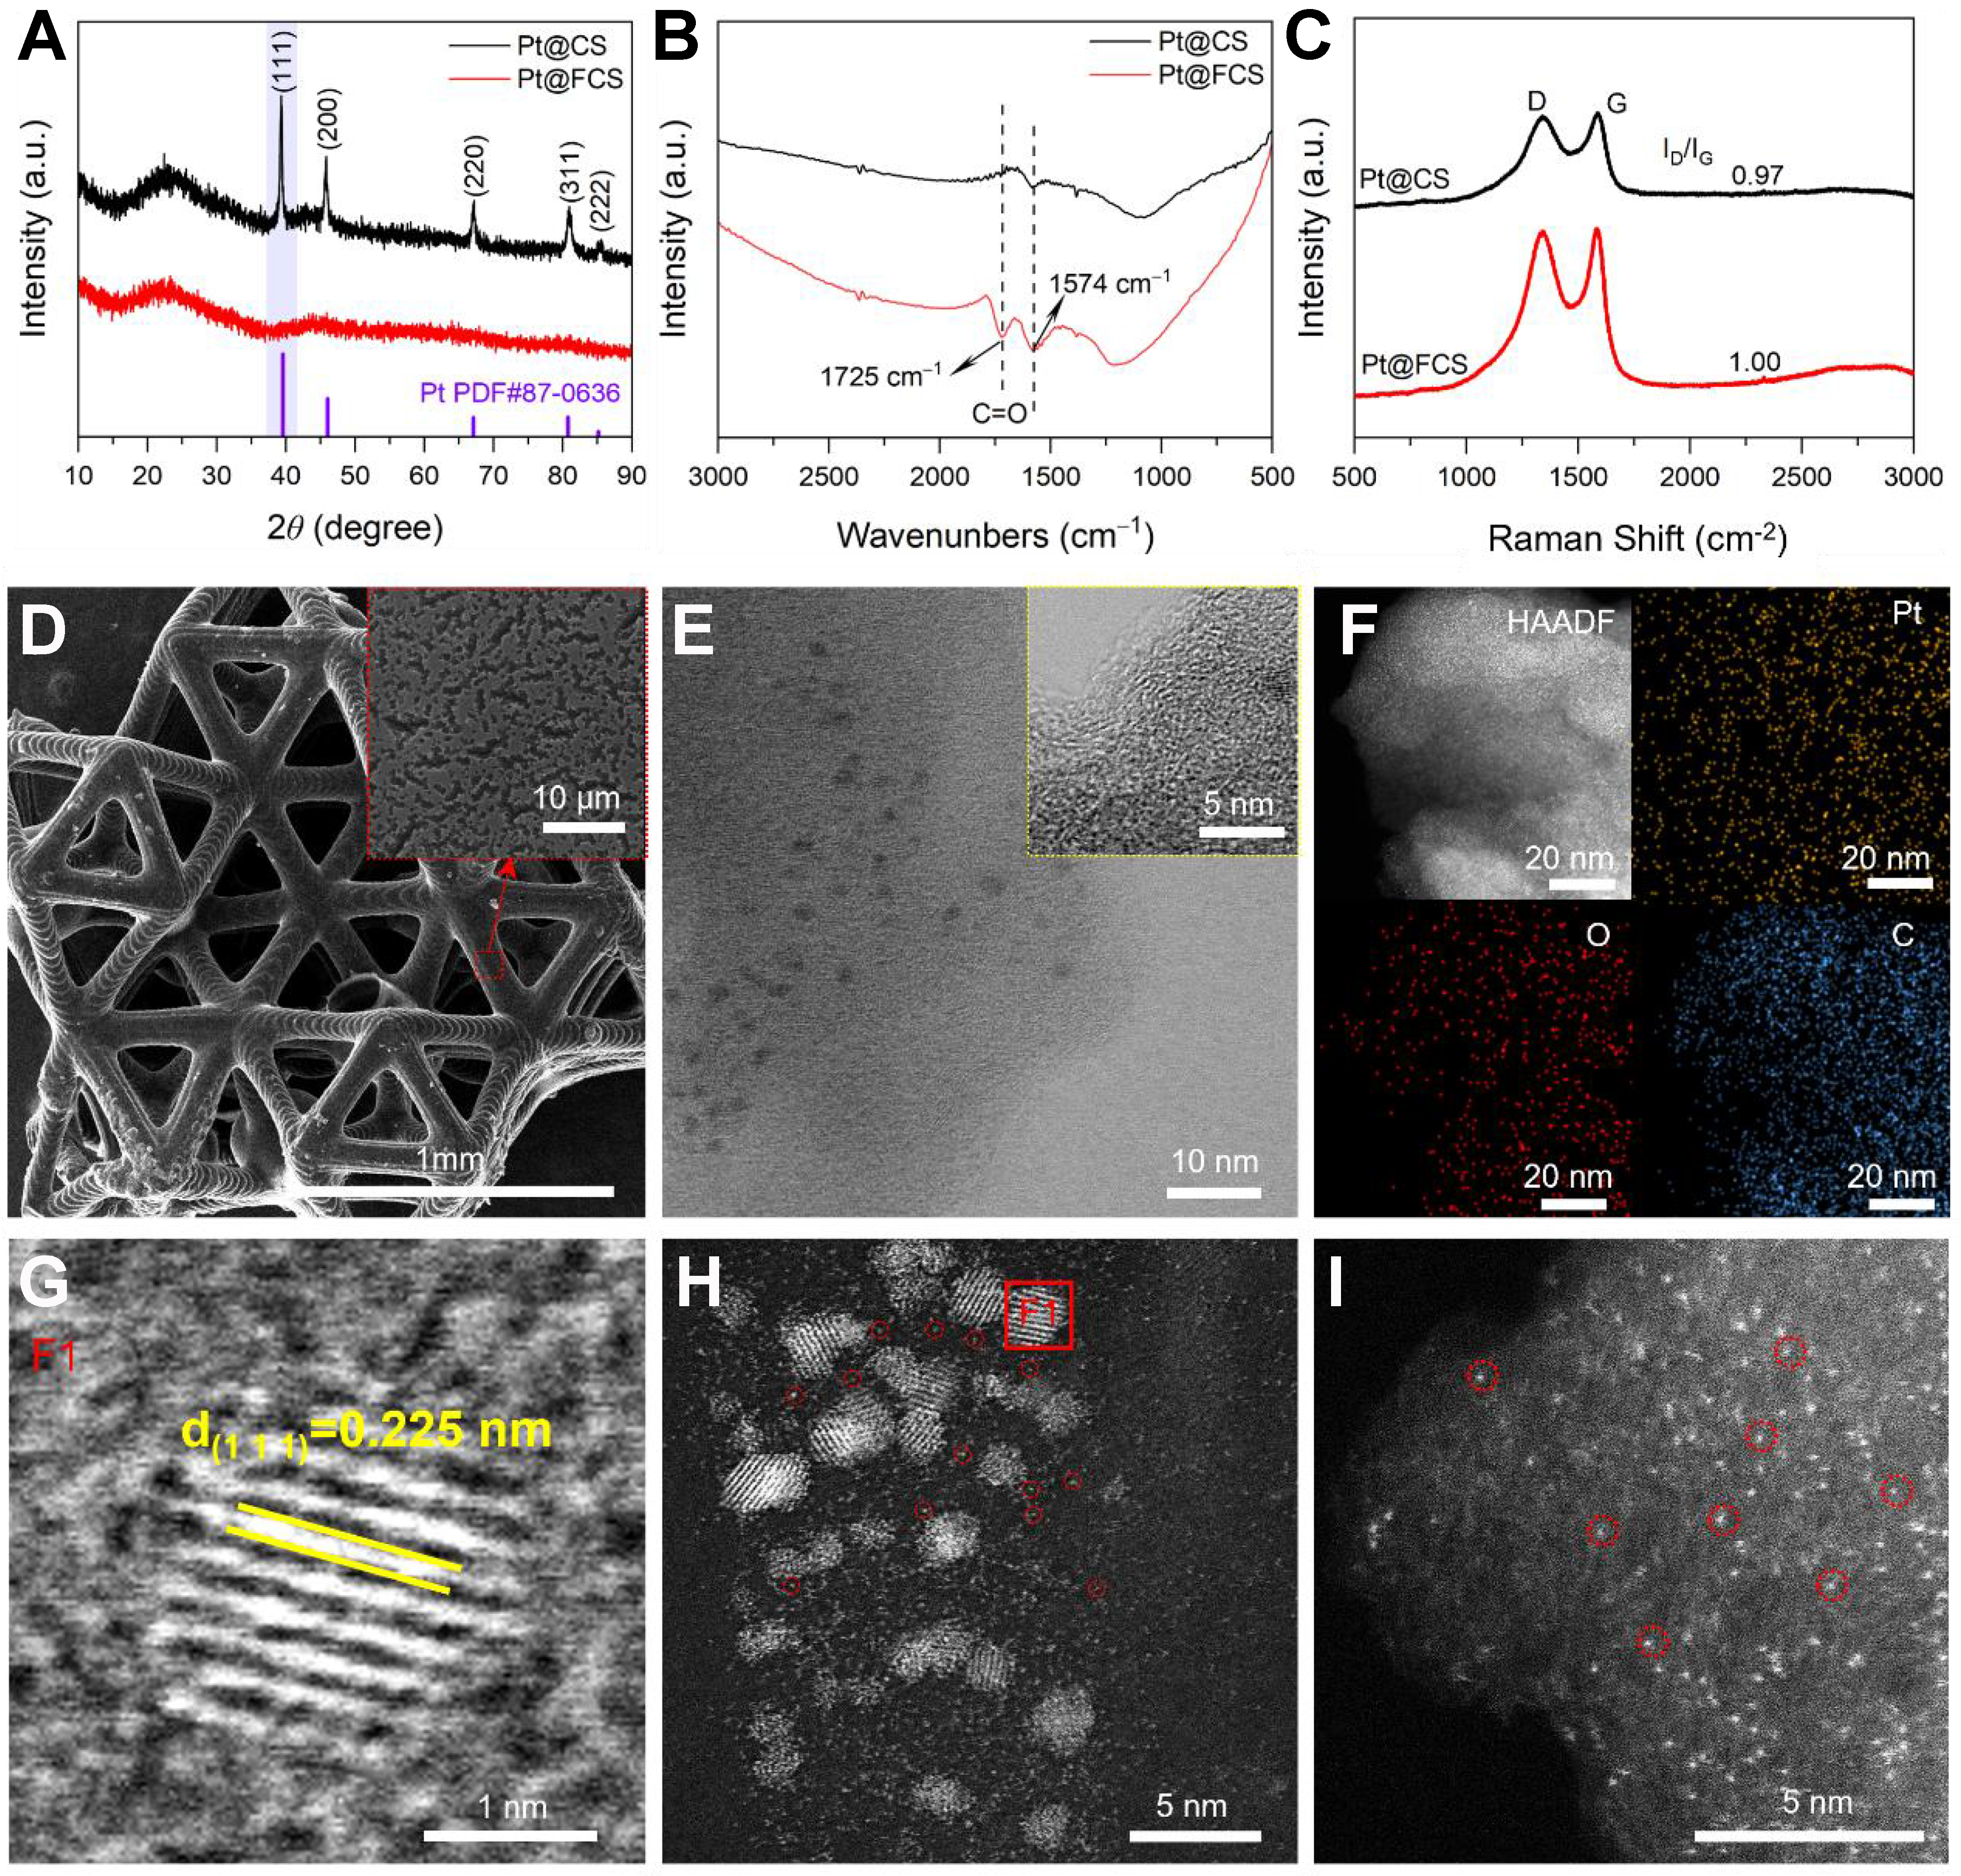
Figure 2. (A) FT-IR spectra of CS and FCS; (B) XRD patterns of Pt@CS and Pt@FCS. The purple vertical lines indicate the standard diffraction peaks of metallic Pt (PDF#87-0636); (C) Raman spectra of Pt@CS and Pt@FCS; (D) SEM image of the Pt@FCS, with an enlarged view of the marked region shown in the inset; (E) HRTEM images Pt@FCS, with the inset showing a higher-magnification view of the boxed area and (F) EDS elemental mapping of Pt@FCS; (G) HRTEM image of a single Pt nanocluster in Pt@FCS, corresponding to the area marked by the F1 in (H); (H) HAADF-STEM images of Pt@FCS highlighting ultrafine Pt NPs and (I) atomically dispersed Pt on FCS. FT-IR: Fourier-transform infrared; CS: carbon support; FCS: functionalized carbon support; XRD: X-ray diffraction; SEM: scanning electron microscopy; HRTEM: high-resolution transmission electron microscopy; EDS: energy-dispersive X-ray spectroscopy; HAADF-STEM: high-angle annular dark field scanning transmission electron microscopy; NPs: nanoparticles.


