


fig5
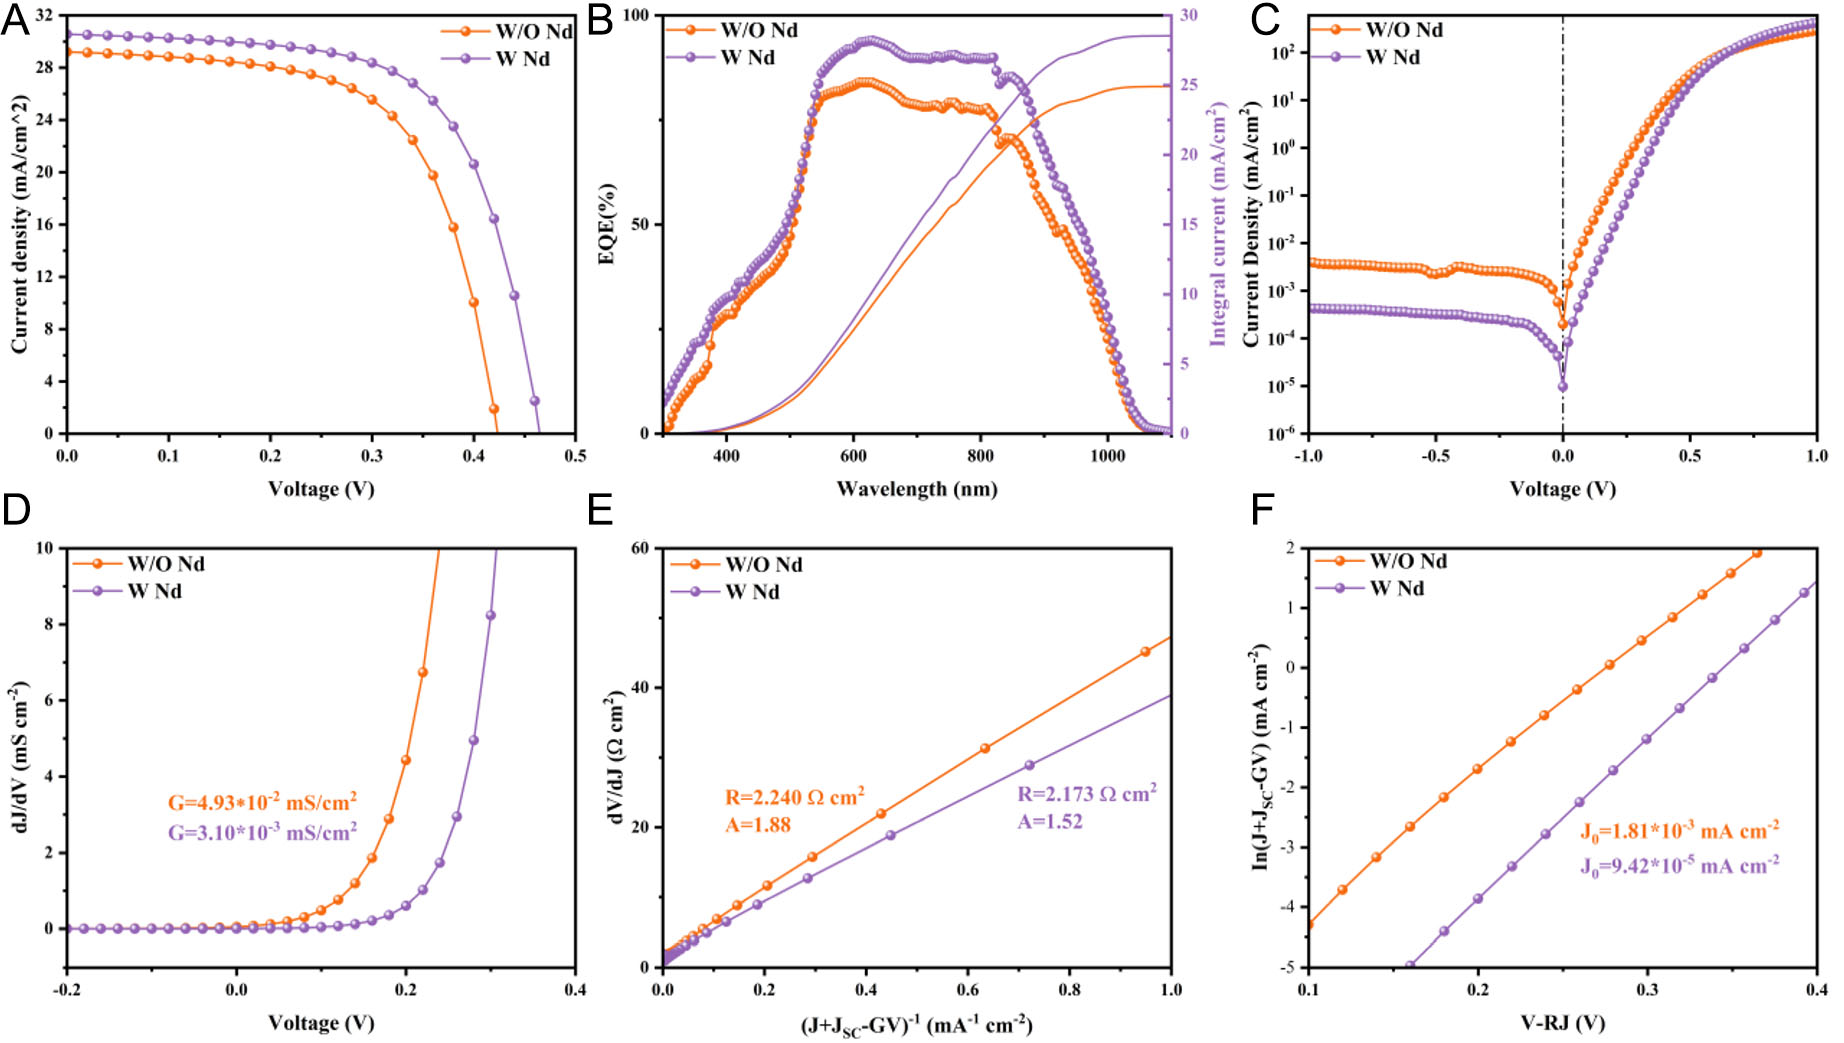
Figure 5. (A) J-V curves, (B) EQE spectra, (C) dark J-V curves, (D) dJ/dV vs. V graph for G extraction, (E) dV/dJ vs. (J + JSC - GV)-1 graph for R and A extraction, and (F) ln(J + JSC - GV) vs. V-RJ graph for J0 extraction, for samples without and with NdCl3 treatment.


