


fig8
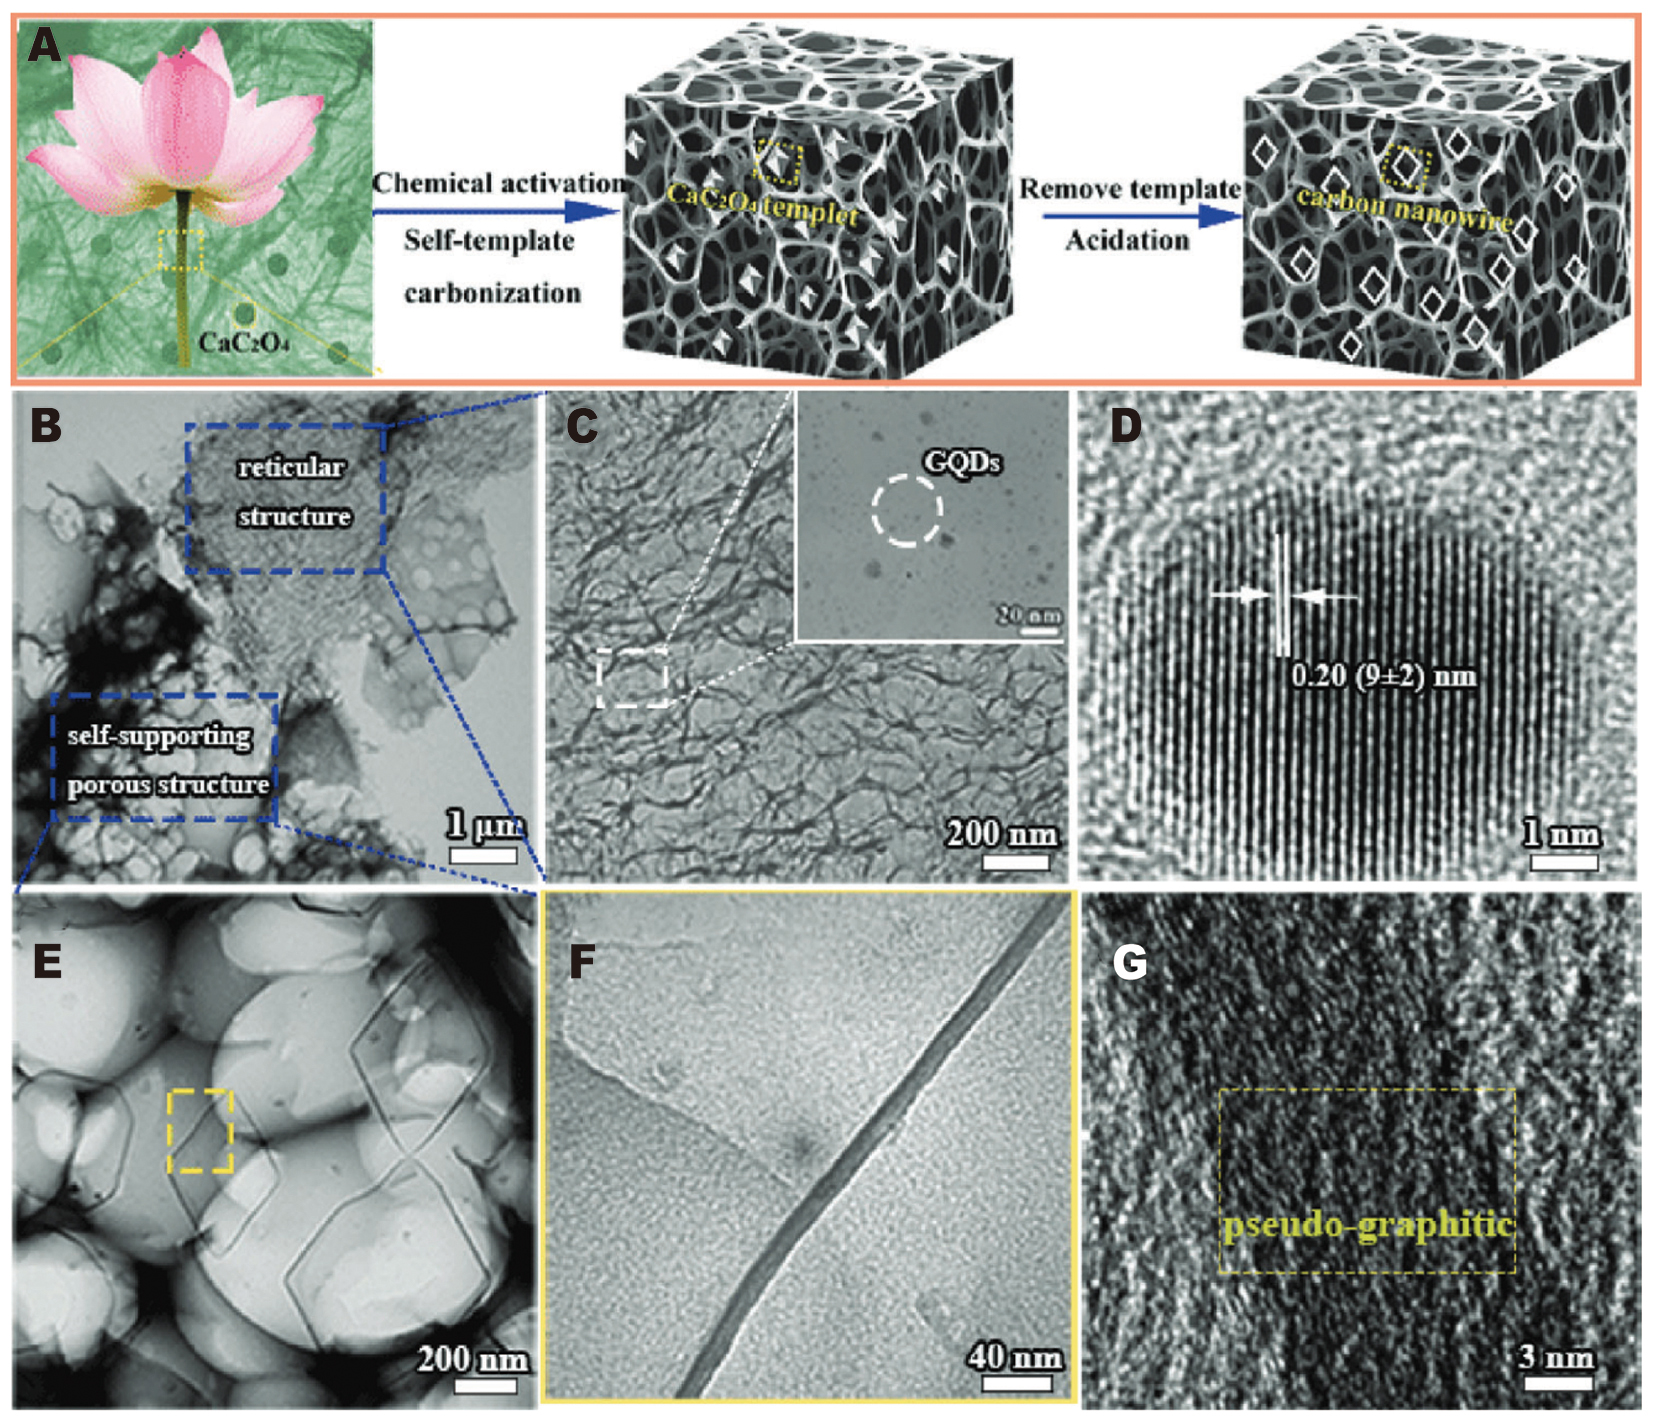
Figure 8. (A) Schematic illustration of the synthesis procedure for LPC materials. (B) Low-magnification transmission electron microscopy (TEM) image of the LPC sample. (C) High-magnification TEM image of LPC showing a reticular structure, with an inset of a locally magnified image of GQDs. (D) Corresponding high-resolution transmission electron microscopy (HRTEM) image of GQDs. (E) High-magnification TEM image of LPC showing a self-supporting porous structure. (F) Local magnified image of the regions indicated by the yellow squares in (E). (G) Corresponding HRTEM image. Reprinted with permission from Ref.[115]. Copyright © 2024 John Wiley & Sons.


