


fig14
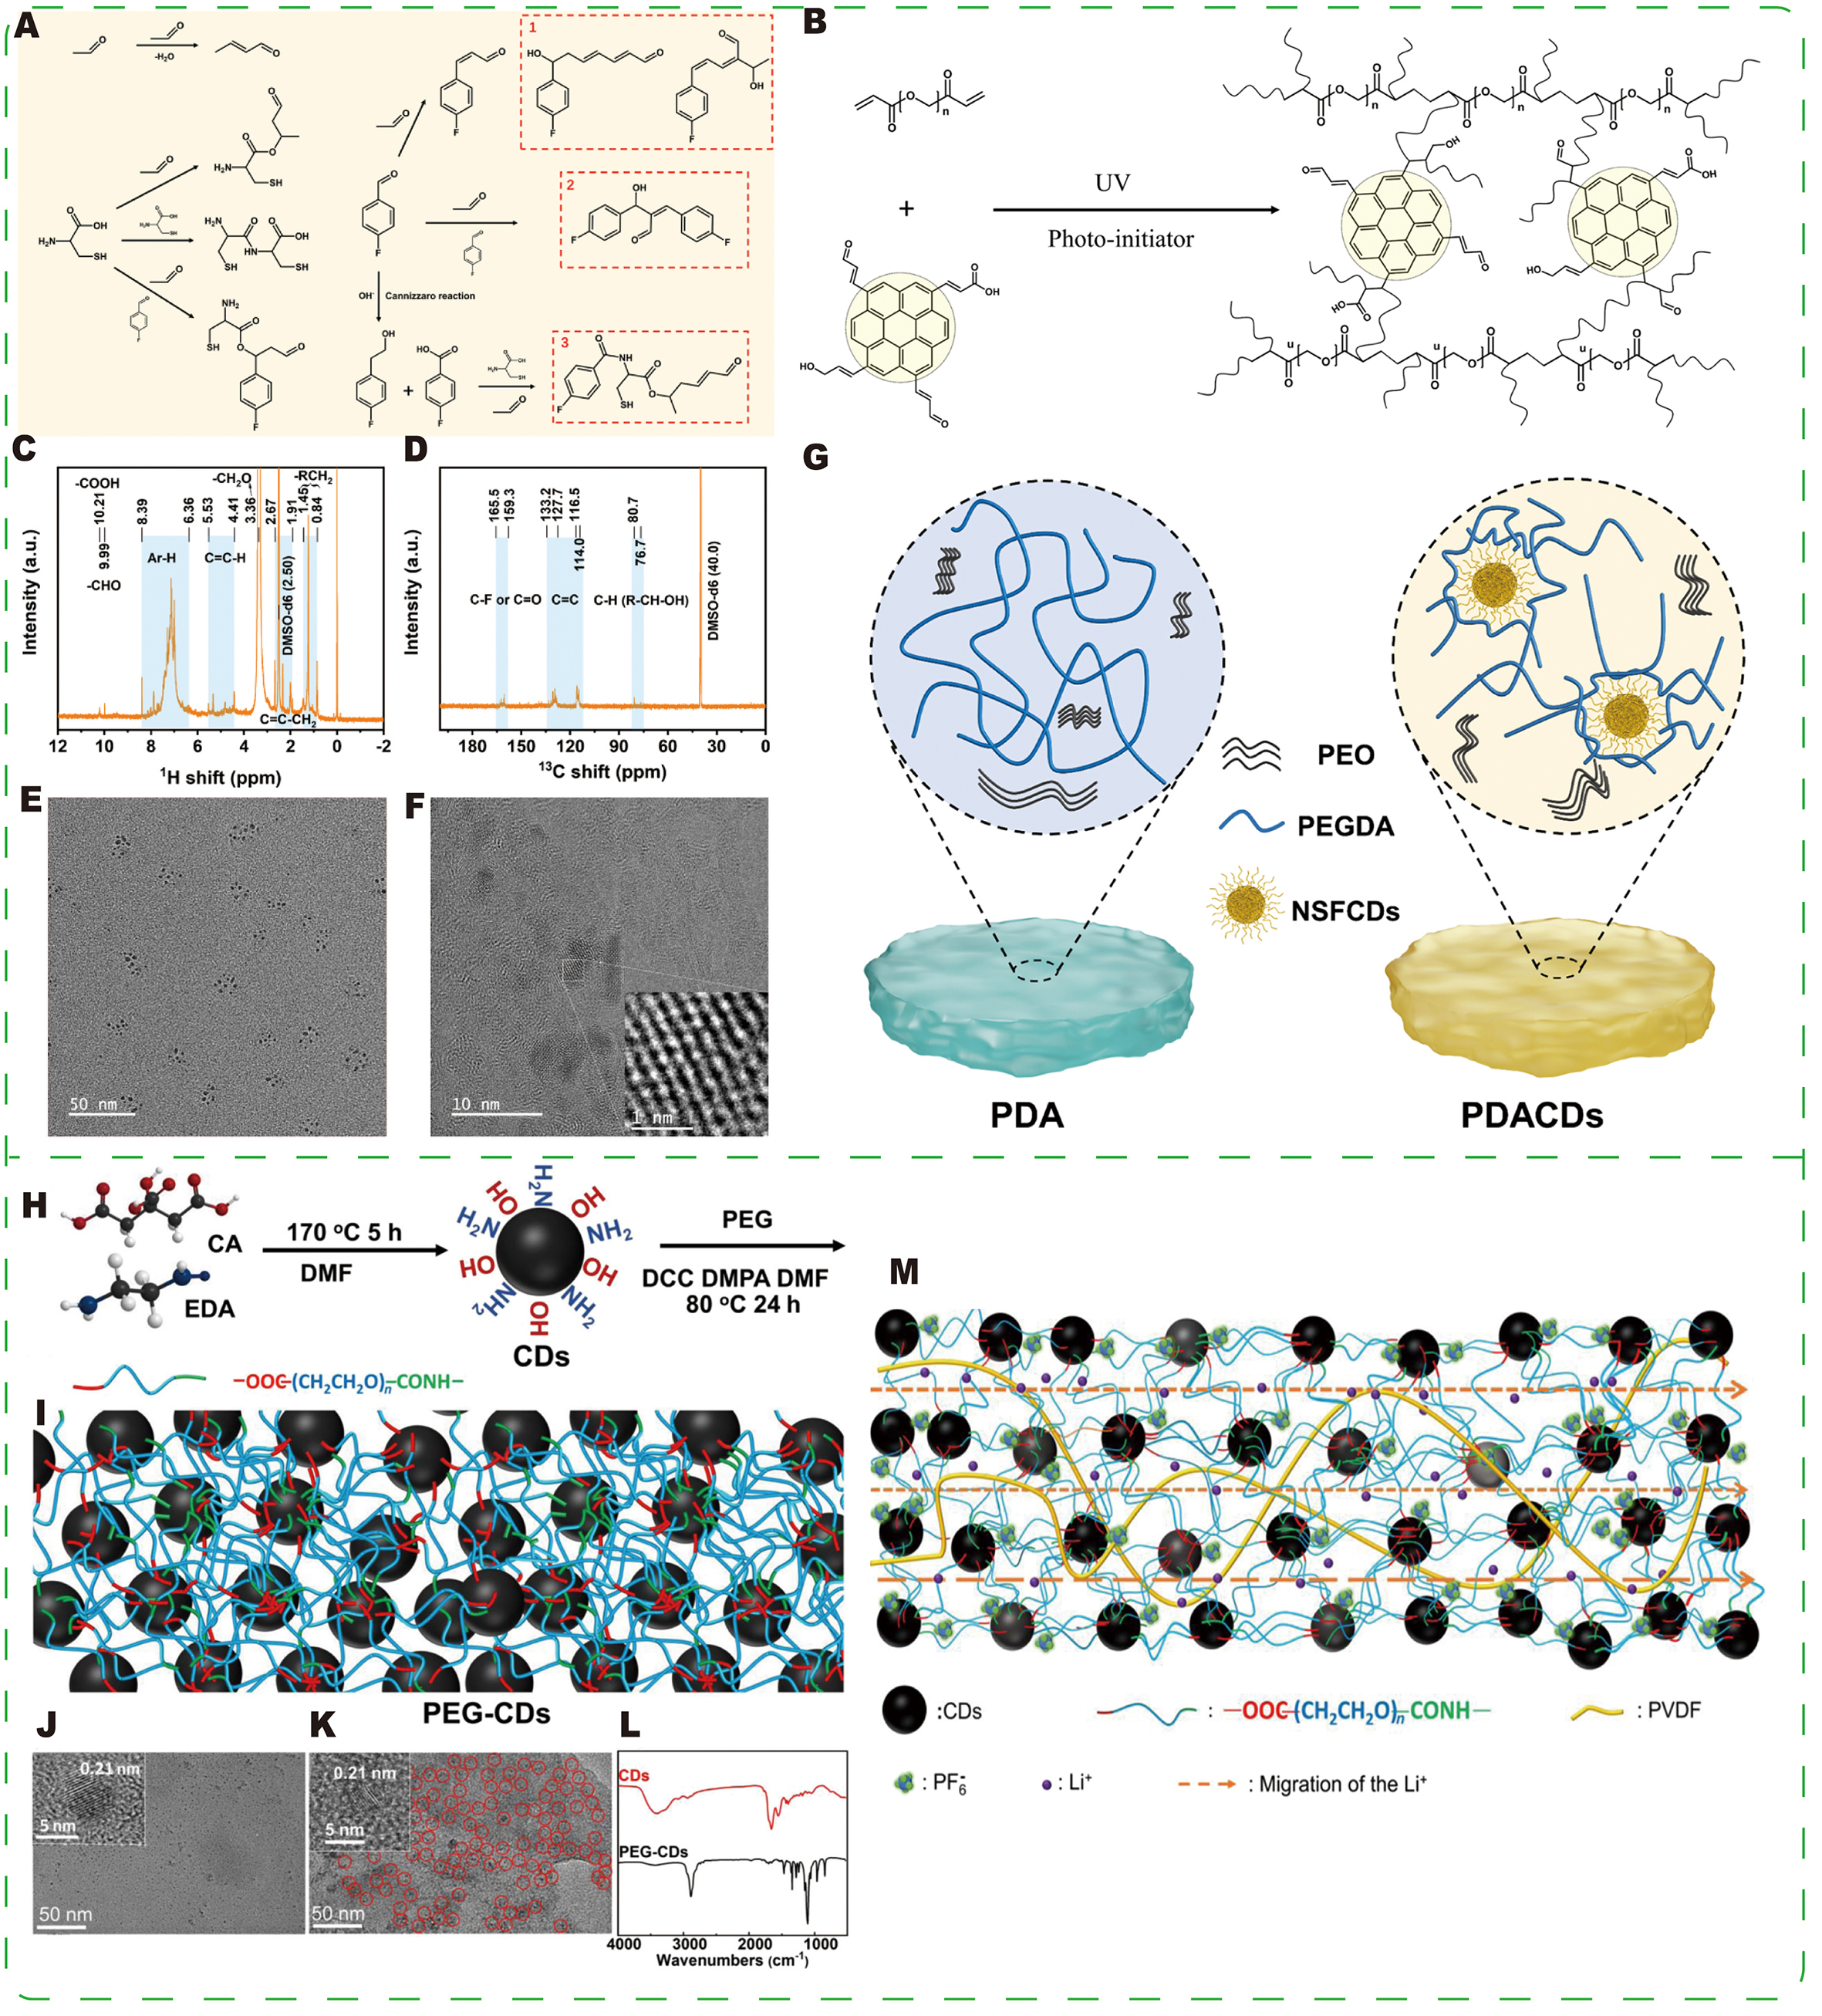
Figure 14. (A) Schematic diagram of the formation of NSFCDs. (B) Schematic diagram of cross-linking between NSFCDs and PEGDA under UV irradiation. 1H nuclear magnetic resonance (NMR) (C) and 13C NMR (D) spectra of NSFCDs. (E) TEM image of NSFCDs. (F) HRTEM image of NSFCDs. (G) Schematic diagram of polymer conformation in HPE. (A-G) Reprinted with permission from Ref.[141]. Copyright © Elsevier. (H) Solvothermal synthesis of CDs from citric acid (CA) and ethylenediamine (EDA), and the subsequent reaction between CDs and PEG to produce (I) PEG-CDs (DCC and DMAP are 1,3-dicyclohexylcarbodiimide and 4-dimethyl aminopyridine, respectively). (J) TEM image of CDs and the inset HRTEM image. (K) TEM image of PEG-CDs and the inset HRTEM image. (L) Fourier transform infrared (FTIR) spectra of CDs and PEG-CDs. (M) Schematic illustration of the mechanisms by which PCCE improves ion conductivity and lithium ion transference number. (H-M) Reprinted with permission from Ref.[142]. Copyright © John Wiley & Sons.


