


fig2
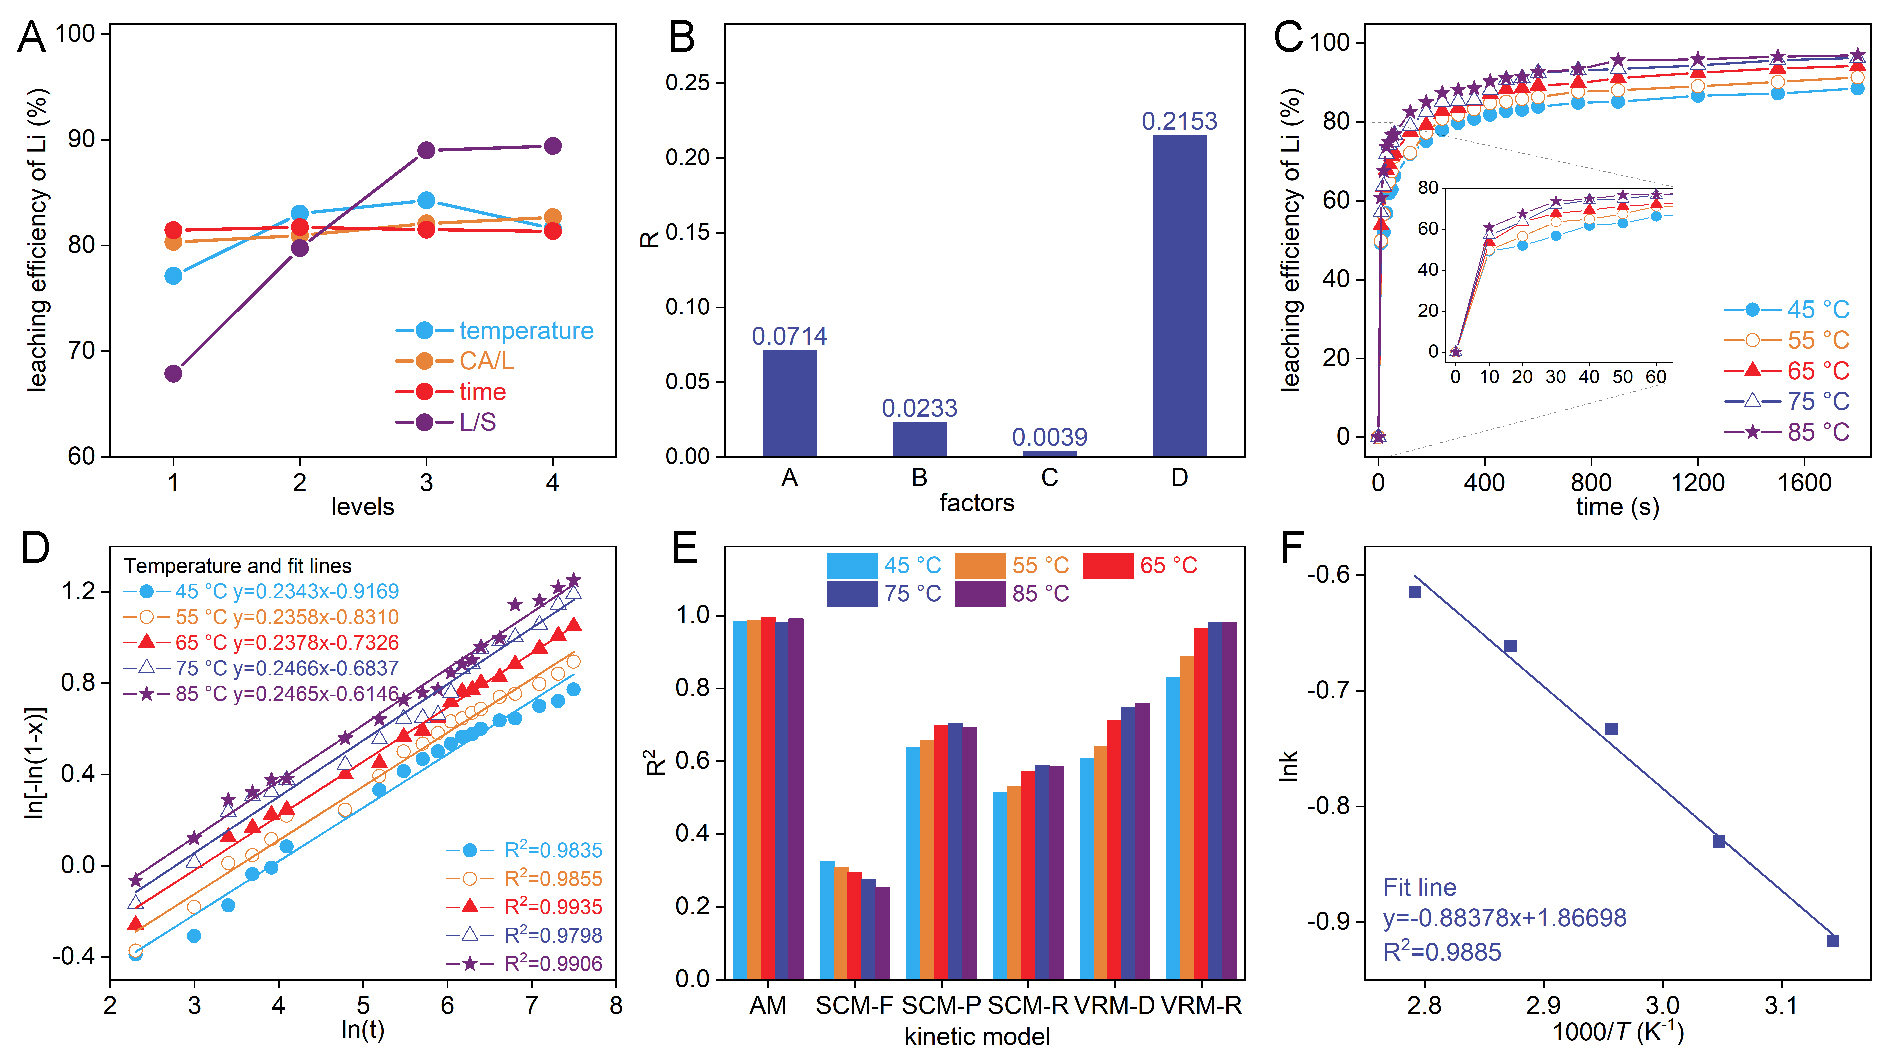
Figure 2. (A) The mean values of factors at various levels and (B) the extreme difference analysis of the mean values in orthogonal experimental design. (C) The leaching efficiency of Li changes with time at different temperatures (CA/L: 1.1, L/S: 10 mL/g). (D) Plots of ln[-ln(1-x)] vs. ln(t) at different temperatures during 0-1,800 s (30 min). (E) The correlation coefficient (R2) between the kinetic models of different control mechanisms and the leaching of Li. (F) Arrhenius plot for Li leaching.


