


fig3
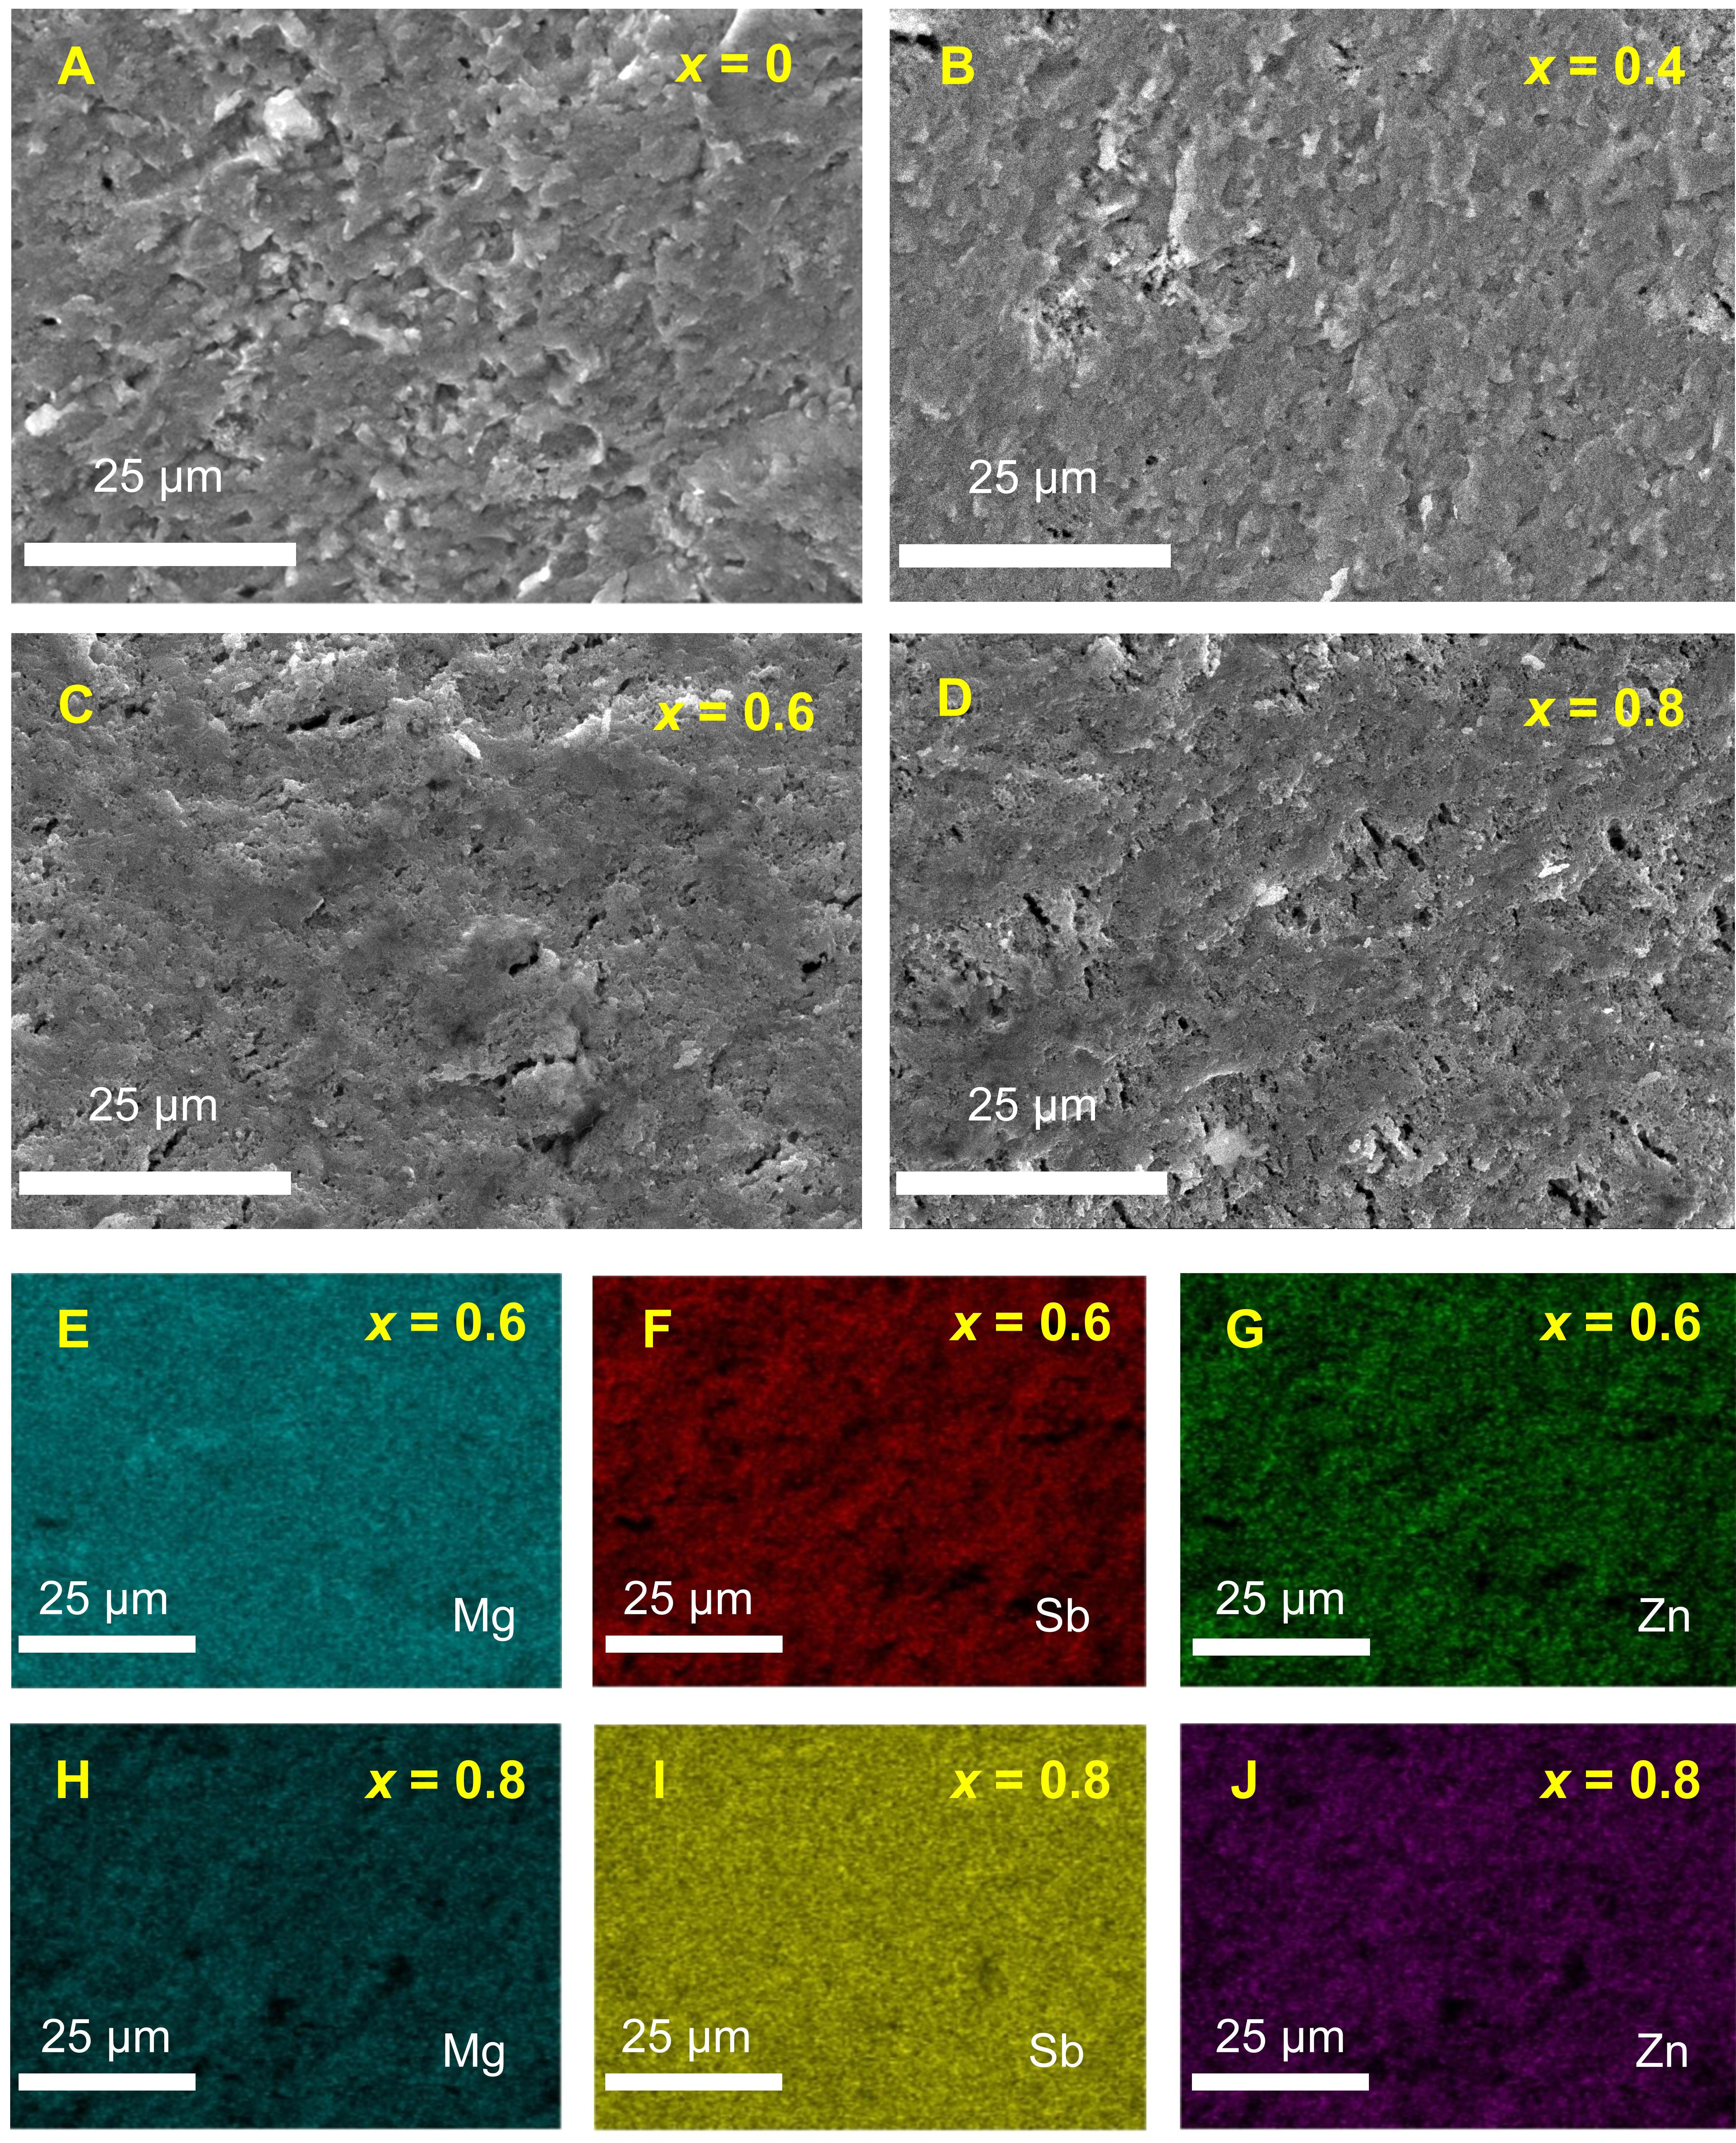
Figure 3. Microstructural characterization of Mg3.1-xZnxSb2 (x = 0, 0.4, 0.6, and 0.8). (A-D) Scanning electron microscopy (SEM) images for x = 0, 0.4, 0.6, and 0.8; (E-G) Energy-dispersive X-ray spectrometer (EDS) elemental mapping for the x = 0.6 sample; (H-J) EDS elemental mapping for the x = 0.8 sample.


