


fig3
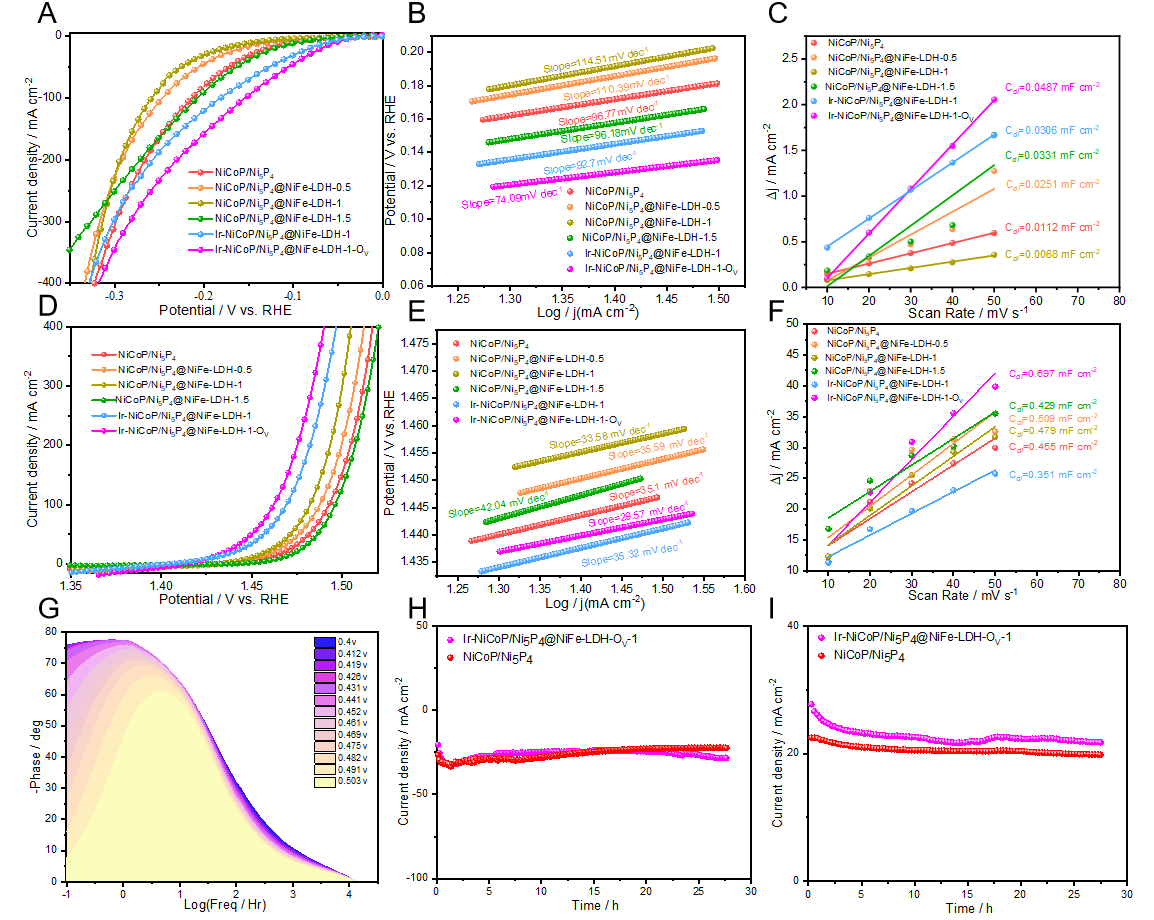
Figure 3. HER and OER performance of the samples in 1 M KOH. (A) LSV curves in HER; (B) Tafel plots in HER; (C) Cdl value; (D) LSV curves in OER; (E) Tafel plots in OER; (F) Cdl value; (G) Bode diagram; (H) Chronoamperometric stability tests (HER); (I) Chronoamperometric stability tests (OER). LSV: Linear sweep voltammetry.


