


fig4
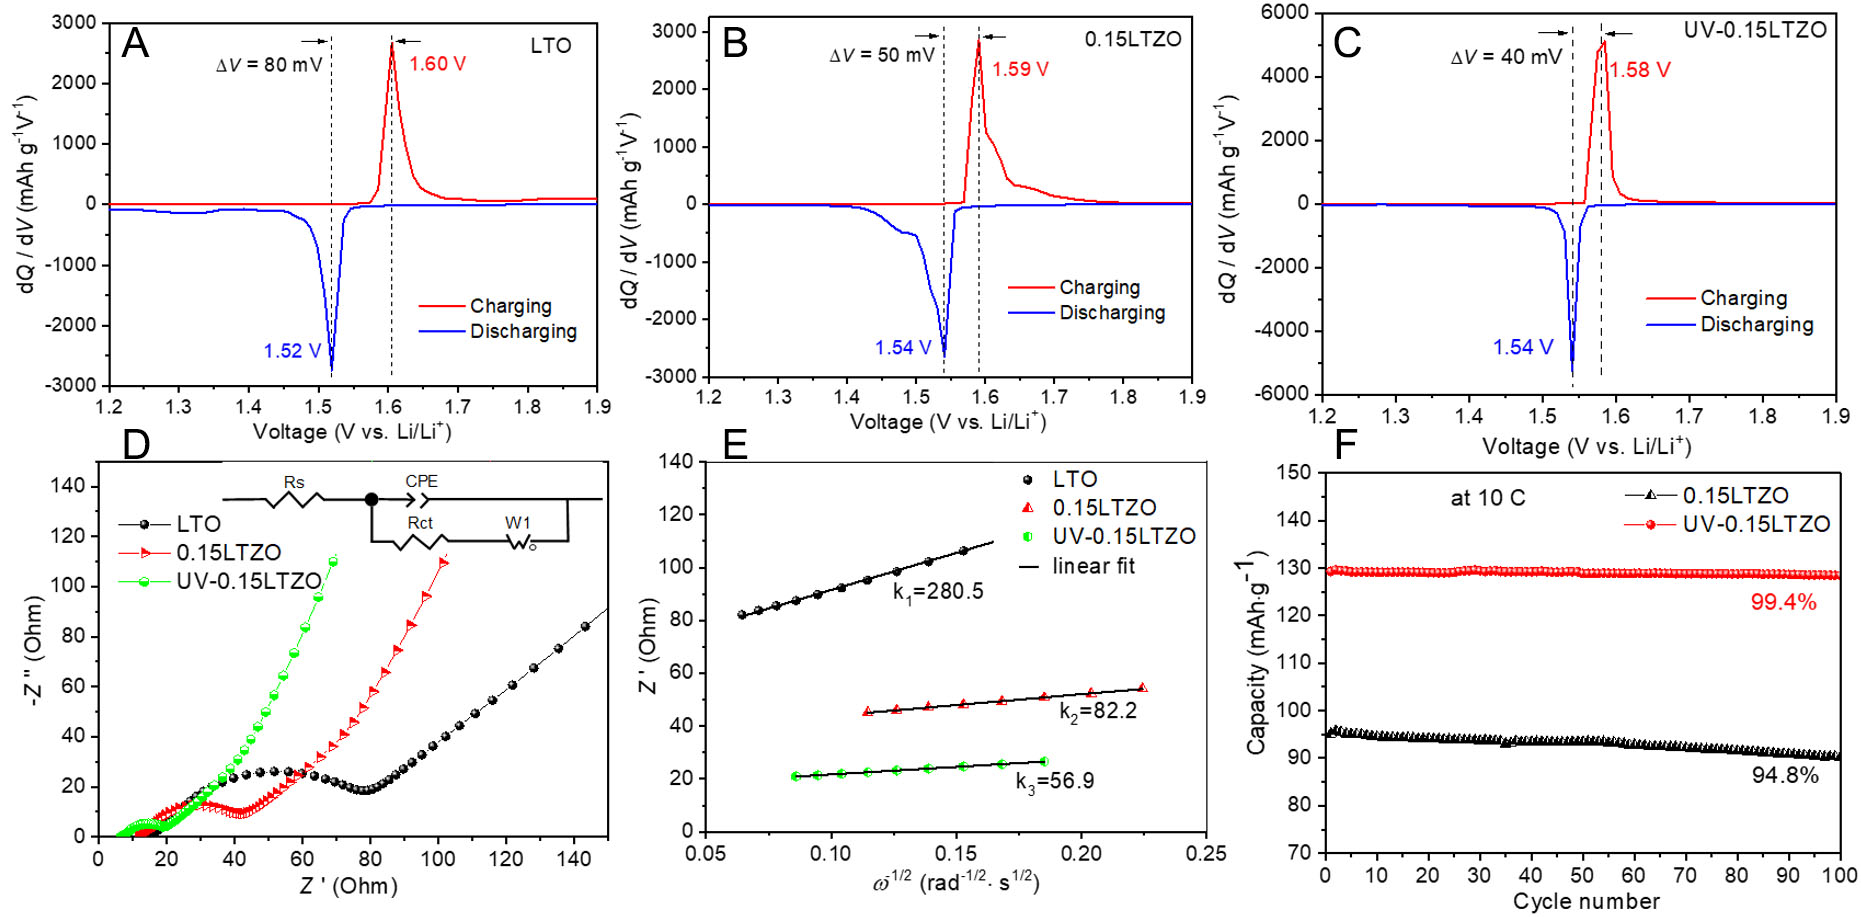
Figure 4. dQ/dV-V curves during the first charge/discharge process at 0.2 C for LTO (A), 0.15LTZO (B), and UV-0.15LTZO (C), respectively. EIS spectra (D) and Z′ - ω-1/2 curves (E) of LTO, 0.15LTZO, and UV-0.15LTZO after 100 charging-discharging cycles. To ensure the electrodes remain within the single-phase region, all EIS spectra were measured at approximately 2.3 V. The inset in (D) is the fitted equivalent circuit. Cycling stability of 0.15LTZO and UV-0.15LTZO (F).


