


fig3
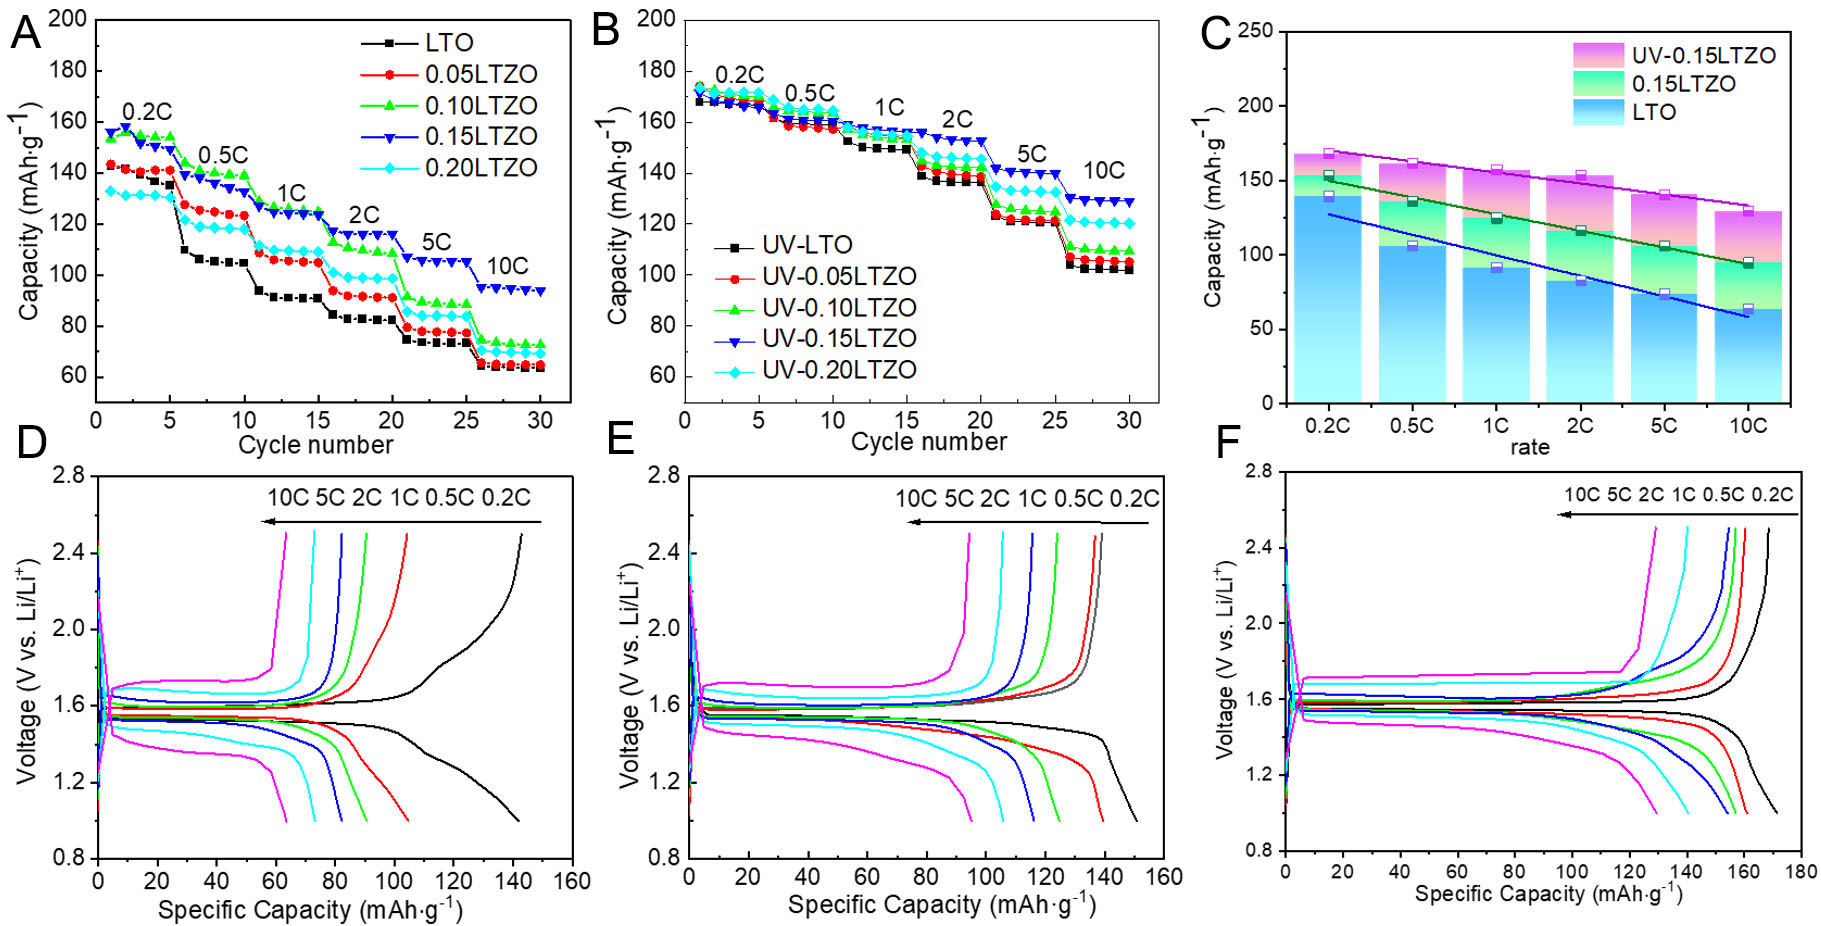
Figure 3. Rate performance of pristine and Zr-doped LTO prepared without (A) and with UV radiation (B). Bar graph showing the capacities of LTO, 0.15LTZO, and UV-0.15LTZO at different rates (C). Charge/discharge curves of pristine LTO (D), 0.15LTZO (E), and UV-0.15LTZO (F) at different rates. The C-rate is a normalized current parameter. An nC rate for LTO corresponds to a current of


