


fig2
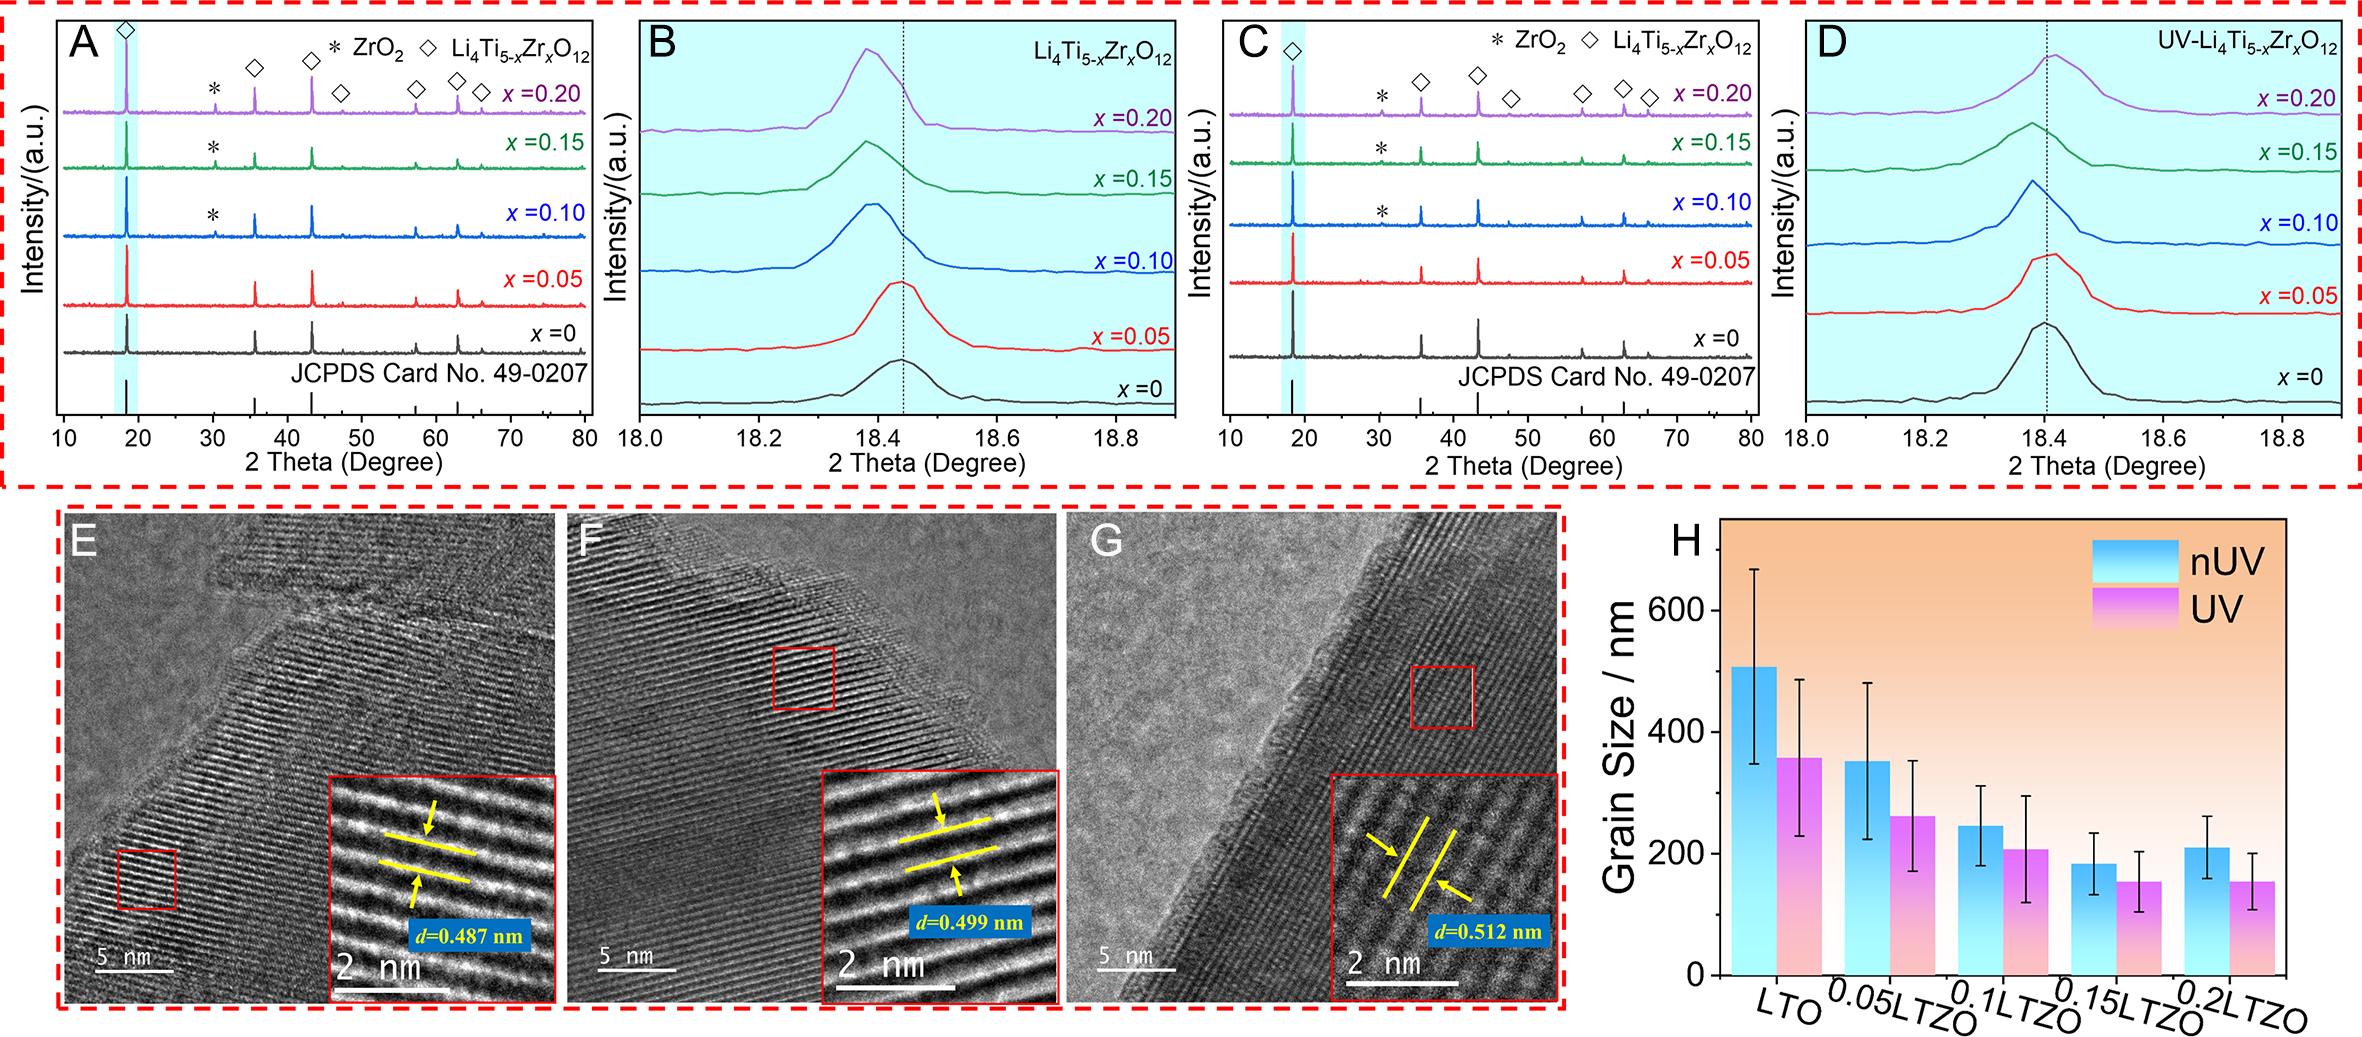
Figure 2. XRD patterns of pristine and Zr-doped LTO prepared without (A and B) and with (C and D) UV radiation. HRTEM images of (111) crystal planes in LTO (E), 0.15LTZO (F), and UV-0.15LTZO (G). Statistical grain size distribution based on SEM images (H). The error bars represent mean ± standard deviation (SD). The difference of grain size is highly statistically significant (Welch's t-test, P < 0.01, Cohen's


