


fig11
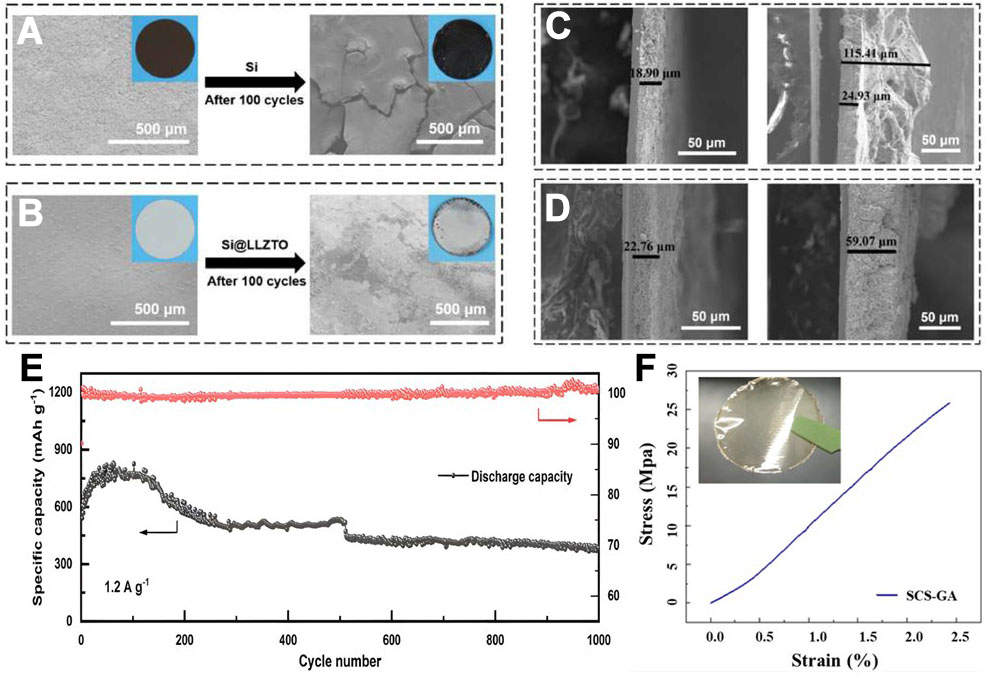
Figure 11. Effect of A-SEI on structural integrity of the Si-based electrode after cycling (A) Si and (B) Si@LLZTO SEM images of the surface of the electrode before and after 100 cycles. Before and after 100 cycles, (C) Si and (D) Si@LLZTO SEM images of the cross-section of the electrode; (E) Schematic diagram of the A-SEI layer and corresponding cycling performance of the battery. Reproduced with permission from Zeng et al., Surfaces and Interfaces (2024). Copyright © Elsevier[103]; (F) Stress-strain curve of the artificial SCS-GA membrane at


