


fig4
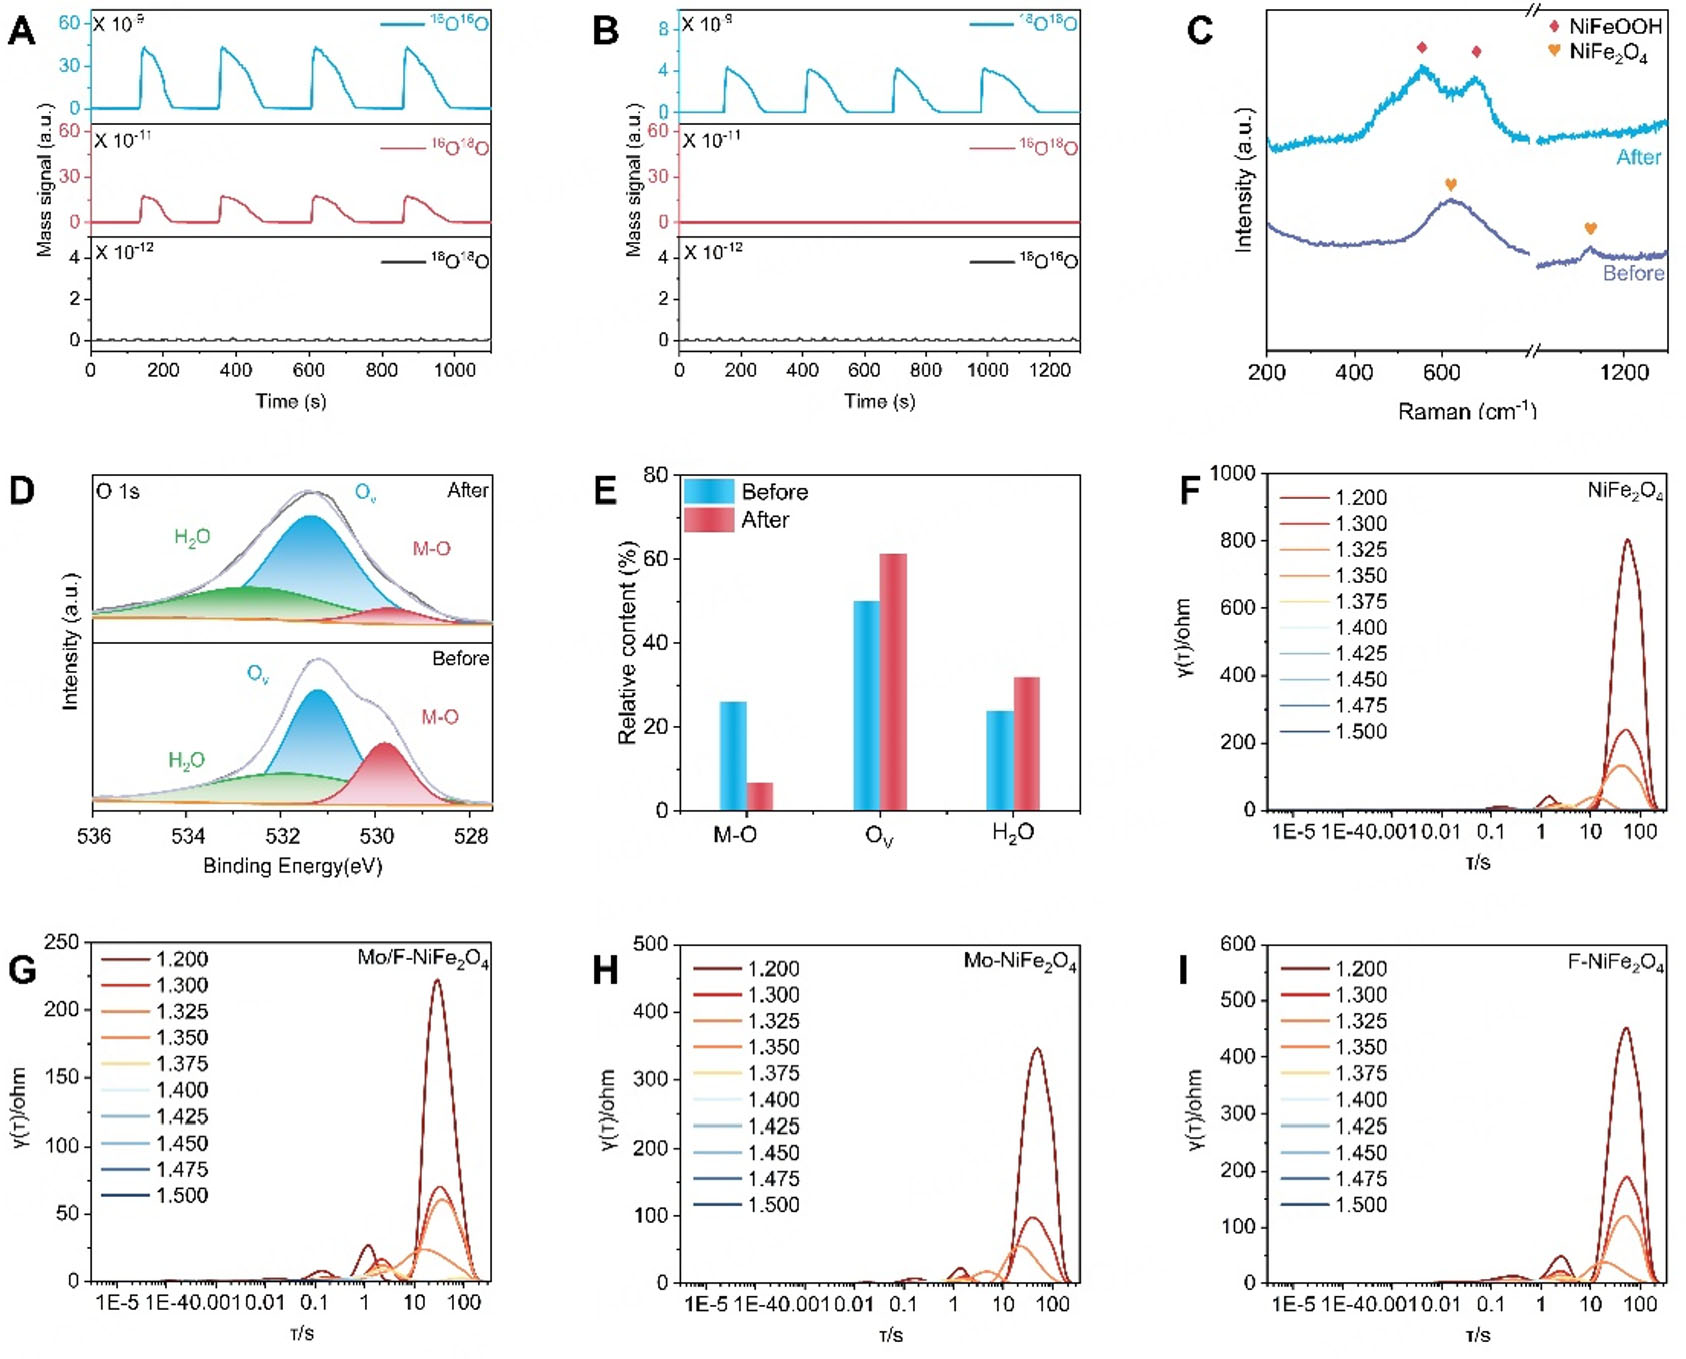
Figure 4. Verification of the LOM pathway and interface changes of Mo/F-NiFe2O4. DEMS of (A) Mo/F-NiFe2O4 and (B) NiFe2O4; (C) Raman spectra ; (D) High-resolution XPS O 1s spectra; (E) Relative content of the different oxygen species of the Mo/F-NiFe2O4 before and after stability test; In-situ impedance testing diagram with corresponding relaxation time distribution diagram of (F) NiFe2O4, (G) Mo-NiFe2O4, (H) F-NiFe2O4 and (I) Mo/F-NiFe2O4.


