


fig4
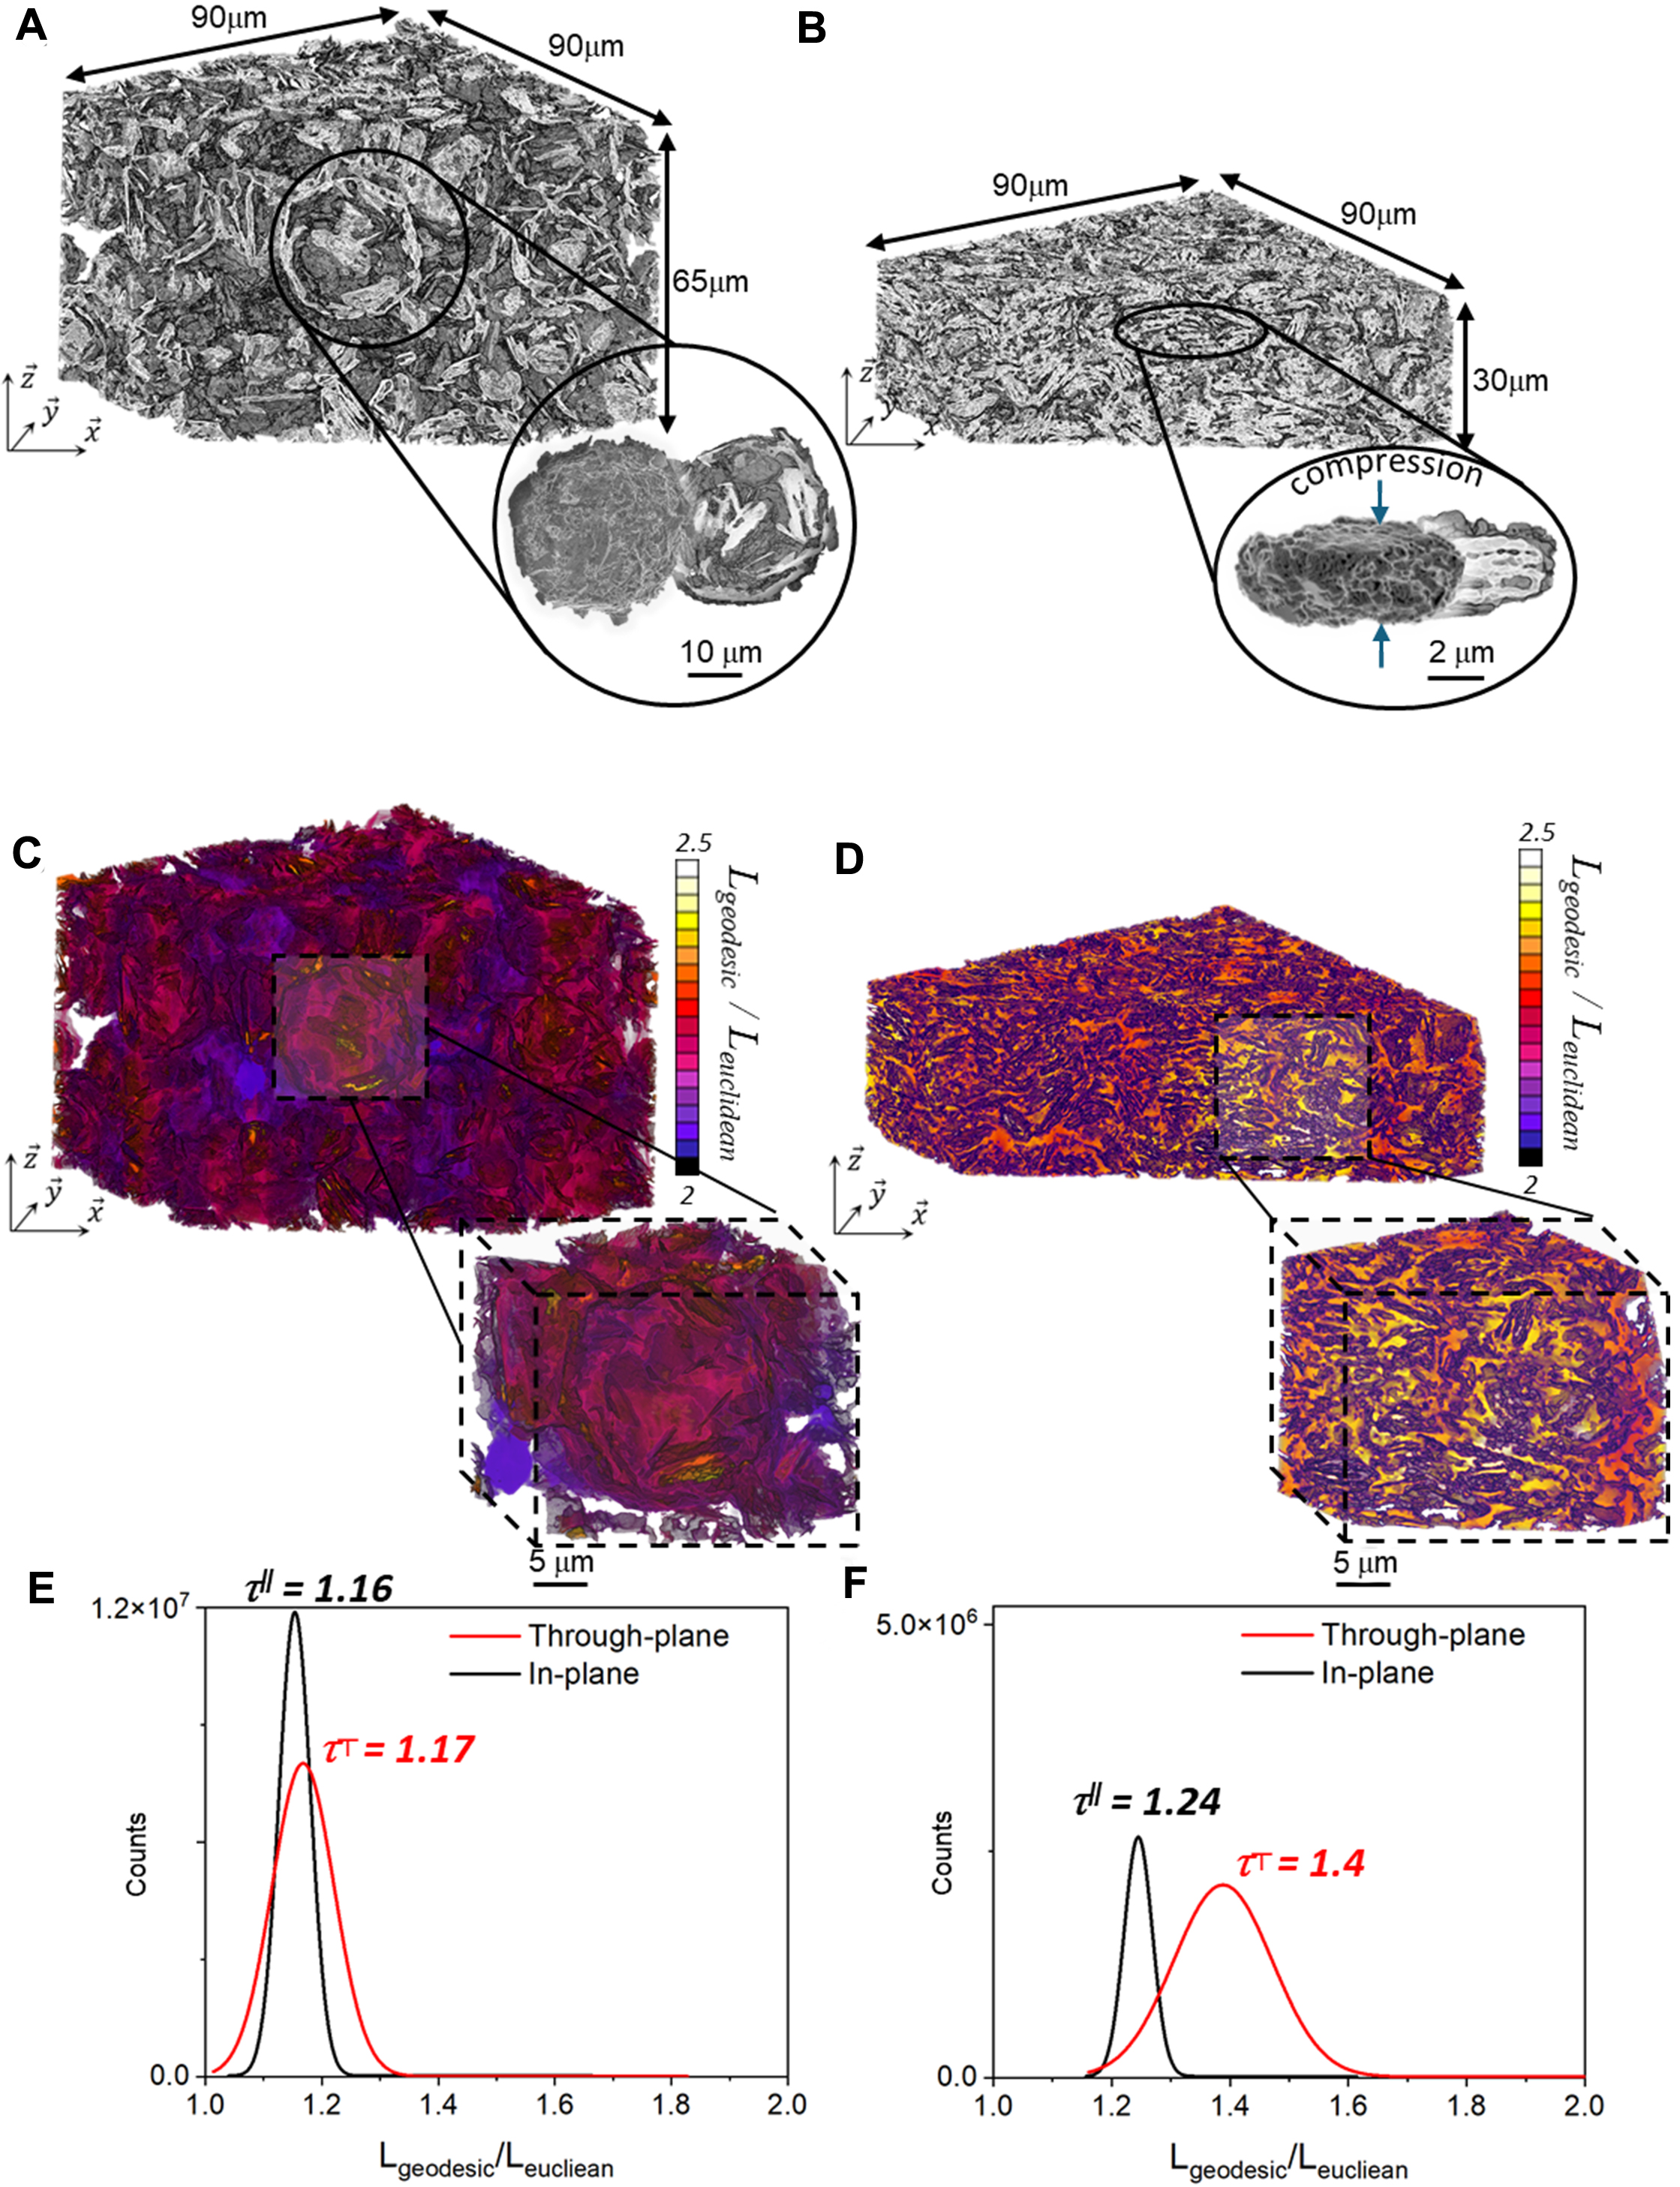
Figure 4. (A and B) 3D representation of the GA-9% nSi-based electrode with a close-up view of an agglomerate, including a cross-section view (A) before and (B) after calendaring. (C and D) Geodesic distance maps for the porosity and corresponding distributions for the electrode (C and E) before and (D and F) after calendaring. 3D: Three-dimensional; GA: graphite agglomerate; nSi: nano-silicon.


