


fig1
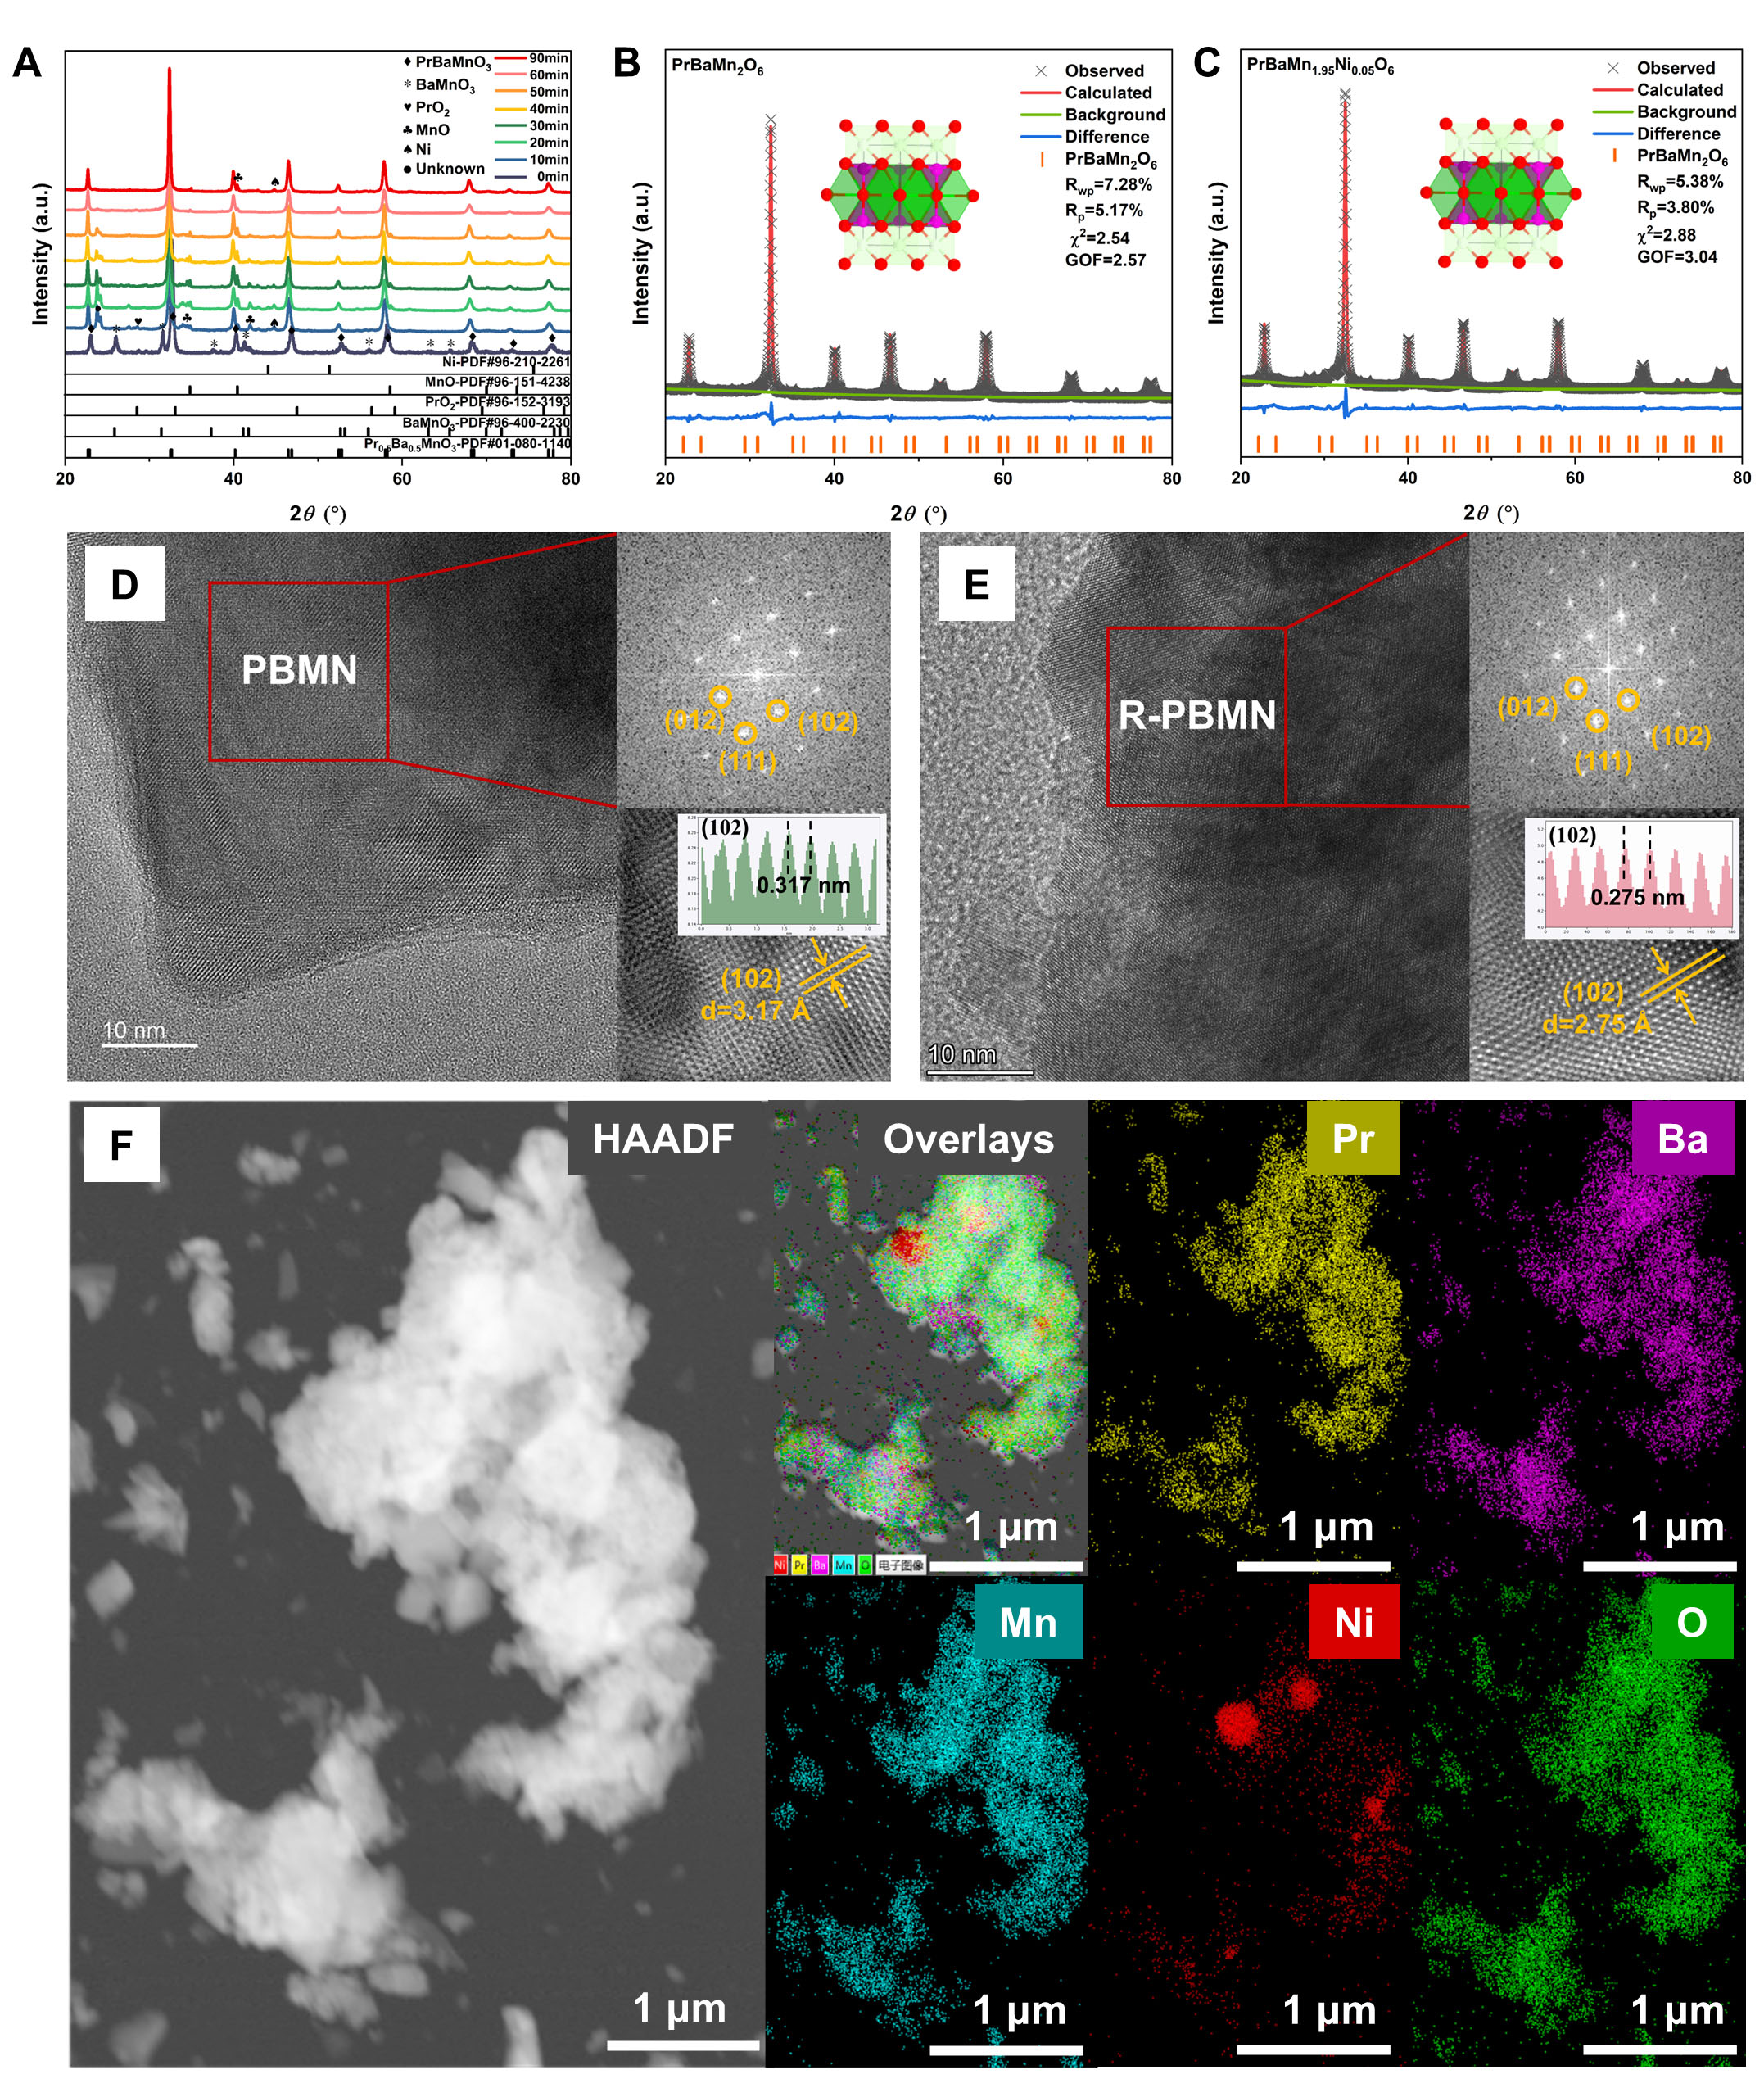
Figure 1. (A) XRD patterns of PBMN and R-PBMN samples after reduction in H2 at 800 °C for 0-90 min, showing phase evolution. Rietveld refinement profiles of (B) R-PBM and (C) R-PBMN, demonstrating good agreement between experimental and calculated patterns; HRTEM images and corresponding FFT patterns of (D) PBMN grain and (E) R-PBMN grain (zone axis [100]); (F) STEM-EDS elemental mappings of Pr, Ba, Mn, Ni and O in an R-PBMN grain.


