


fig3
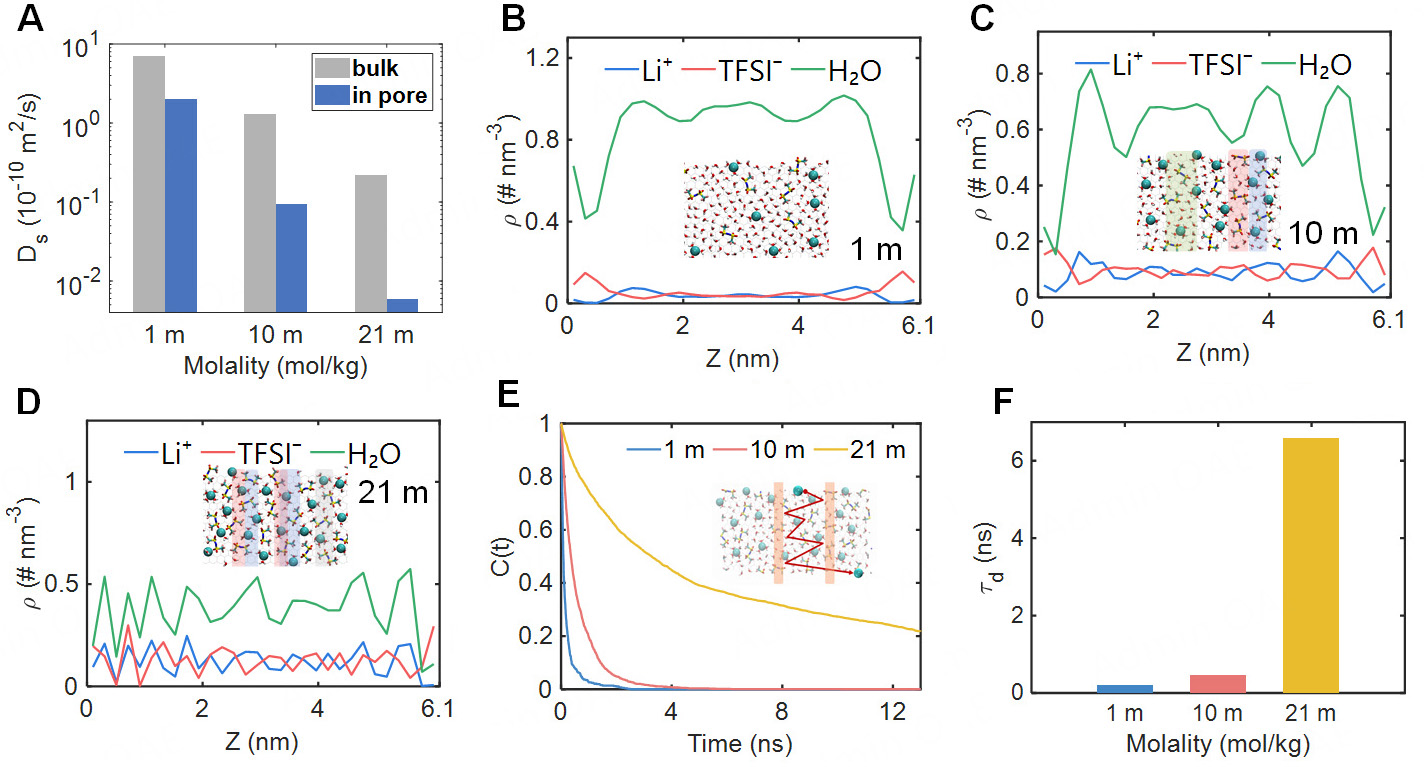
Figure 3. Ion transport mode of LiTFSI electrolyte in subnanopore. (A) The cations diffusion coefficients, Ds, of the electrolyte at the concentration of 1 m, 10 m, 21 m, with red bars representing in-pore values and gray bars representing bulk values; (B-D) The electrolyte number-density distributions along the pore axis (Z-direction) at concentrations of 1 m, 10 m and 21 m, with simulation snapshots at the corresponding concentrations shown as illustrations. (E) Time correlation function, C(t), for Li+ leaving the interlayer region, with schematic diagram of Li+ transport within the interlayer; (F) Average residence time, τd, of Li+ leaving the interlayer region.


