


fig1
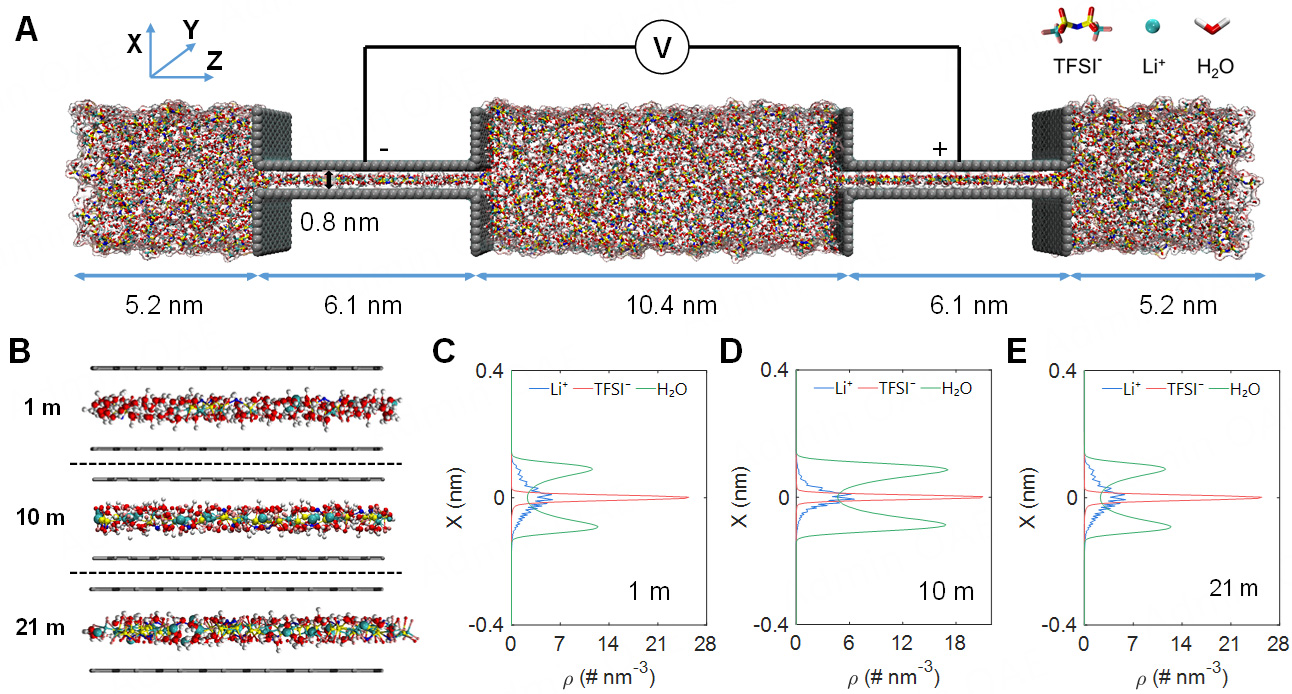
Figure 1. Molecular dynamics model and electrolyte distribution in subnanopore. (A) Schematics of MD simulation; the electrodes are modeled as slit pores with a pore width of 0.8 nm, and the electrolyte comprises Li+, TFSI- and water molecules (H2O); (B) Simulation snapshot along the pore length; (C-E) The number density distributions of electrolytes along the X-direction of the pore width. The water number density in (C) is scaled by 1/6 to illustrate component distributions better.


