


fig9
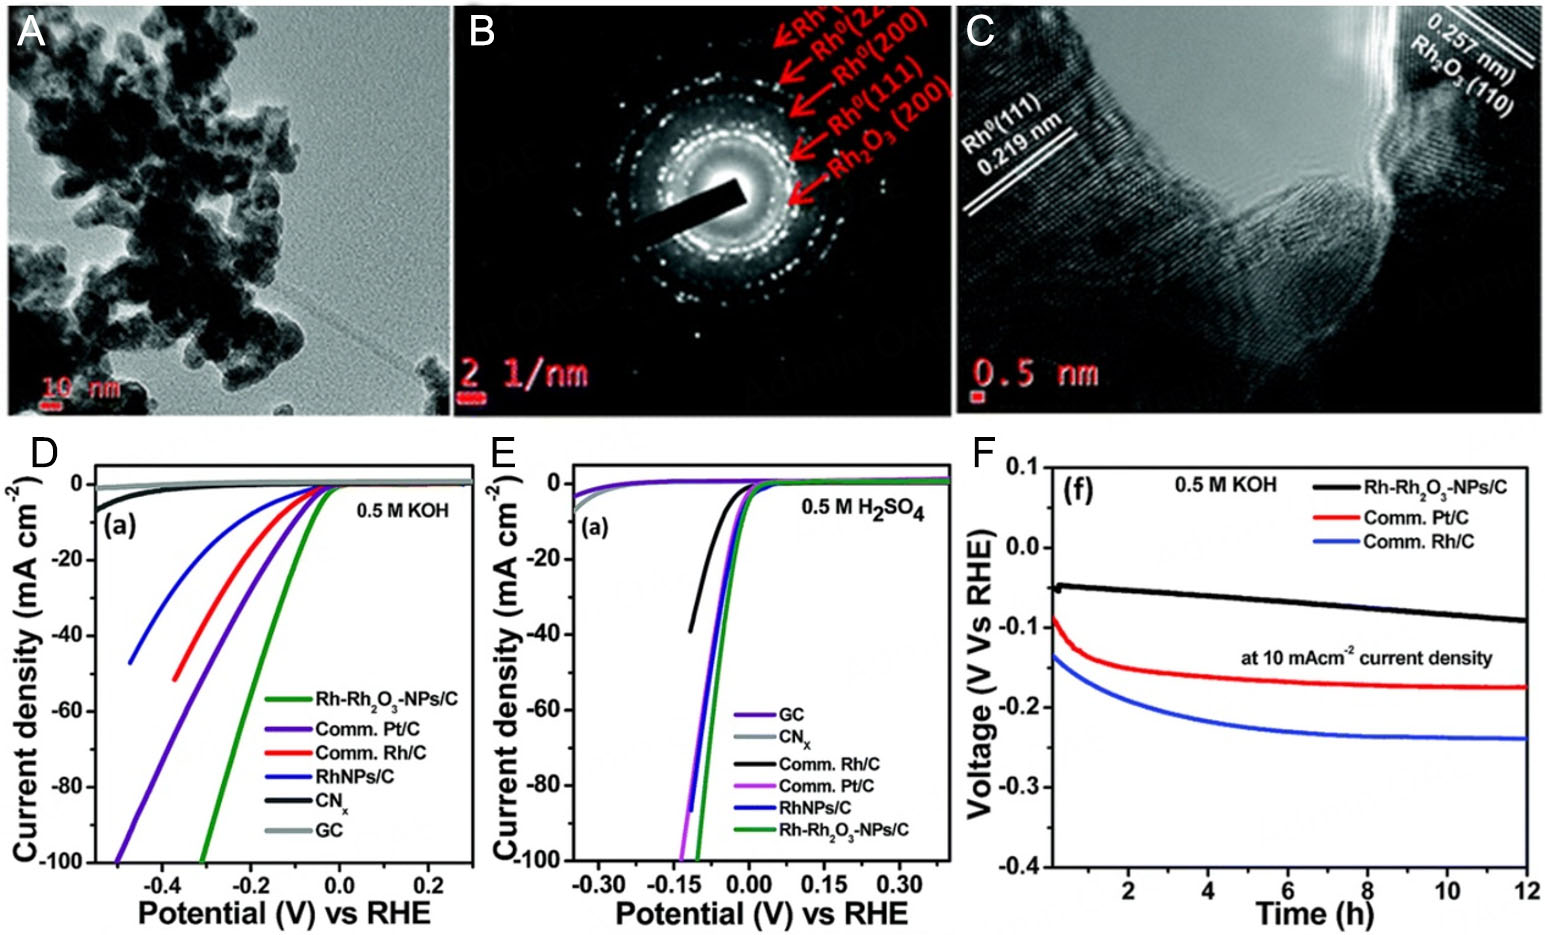
Figure 9. (A) TEM, (B) SAED and (C) HRTEM images of the Rh-Rh2O3-NPs/C composite. (D) HER curves of Rh-Rh2O3-NPs/C, comm. Pt/C, comm. Rh/C, RhNPs/C, CNx and GC in 0.5 M KOH (E) 0.5 M H2SO4. (F) Chronopotentiometric stability of Rh-Rh2O3-NPs/C, Pt/C and Rh/C at 10 mA cm-2. This figure is reproduced from Ref.[74] with permission. Copyright 2018, Royal Society of Chemistry.


