


fig8
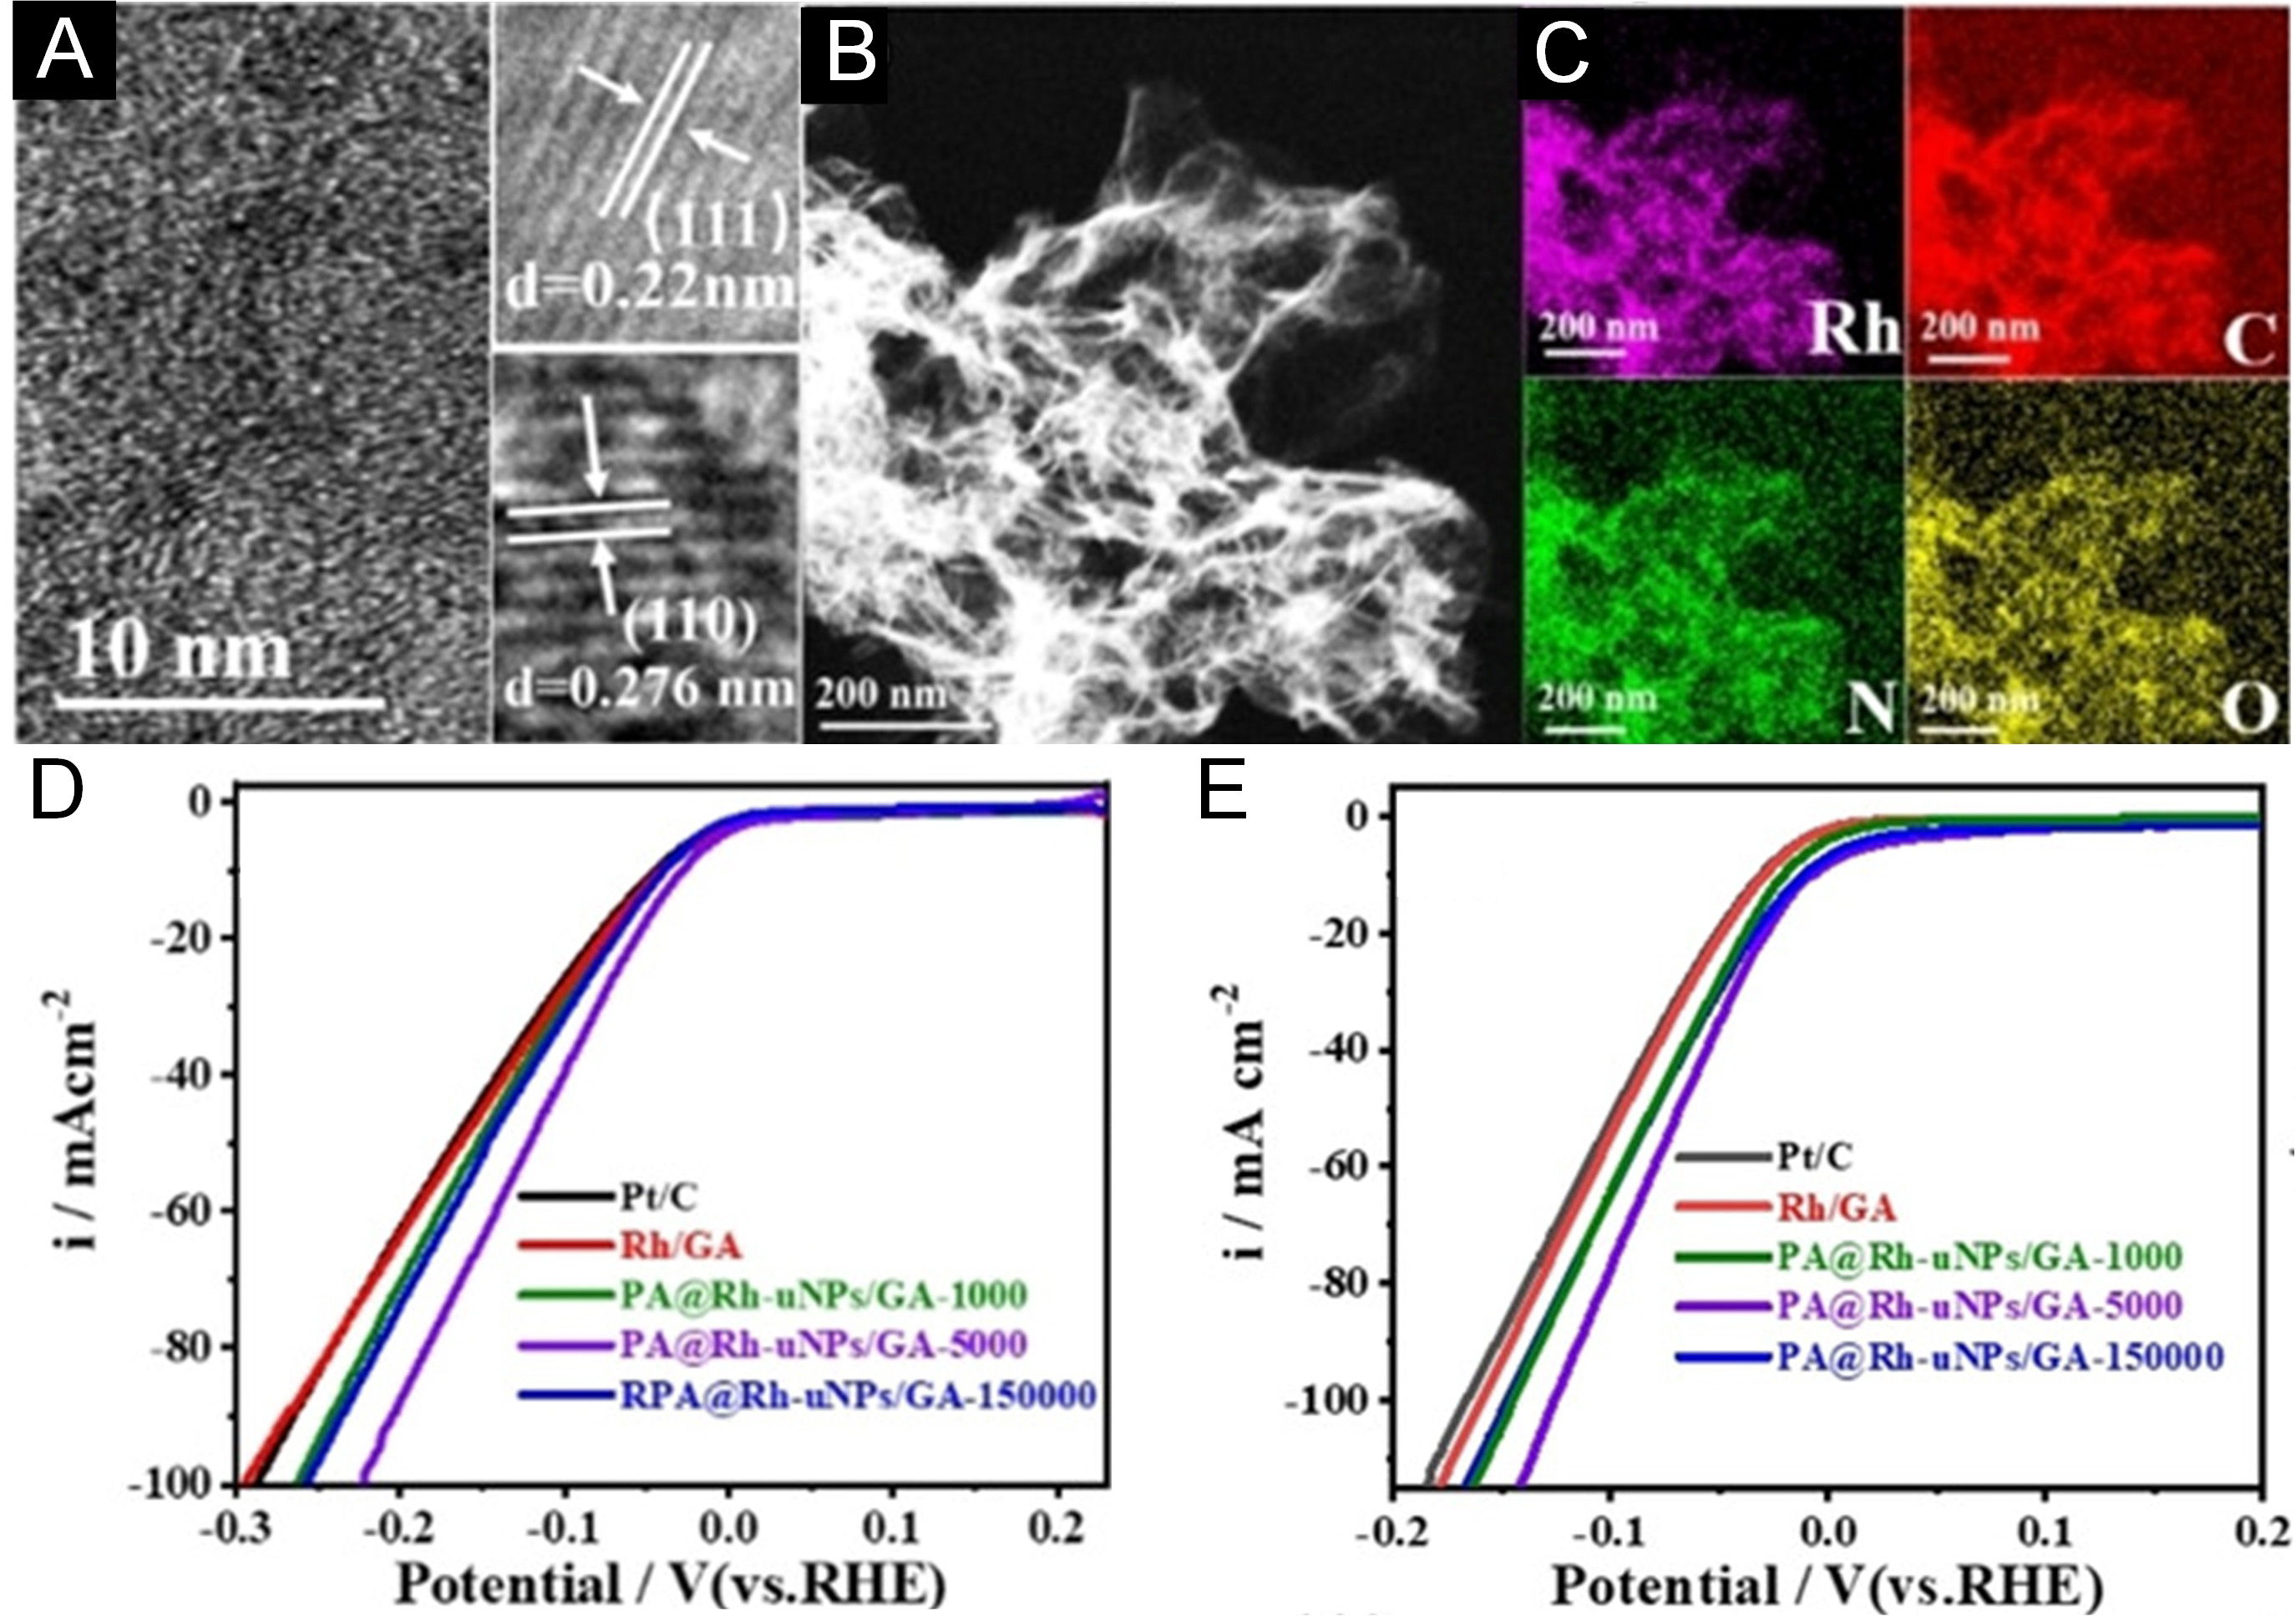
Figure 8. (A) High-resolution TEM image of PA@Rh uNPs/GA-5000 nanocomposites. (B) STEM image and (C) corresponding EDX elemental distribution maps for PA@Rh-uNPs/GA-5000. (D and E) HER polarization curves of various electrocatalysts-including PA@Rh-uNPs/GA-5000, PA@Rh-uNPs/GA-1000, PA@Rh-uNPs/GA-150000, Rh/GA nanocomposites, and commercial 20% Pt/C-measured in (D) 0.1 M HClO4 and (E) 0.1 M KOH electrolytes, respectively. This figure is reproduced from Ref.[114] with permission. Copyright 2021, Wiley.


