


fig7
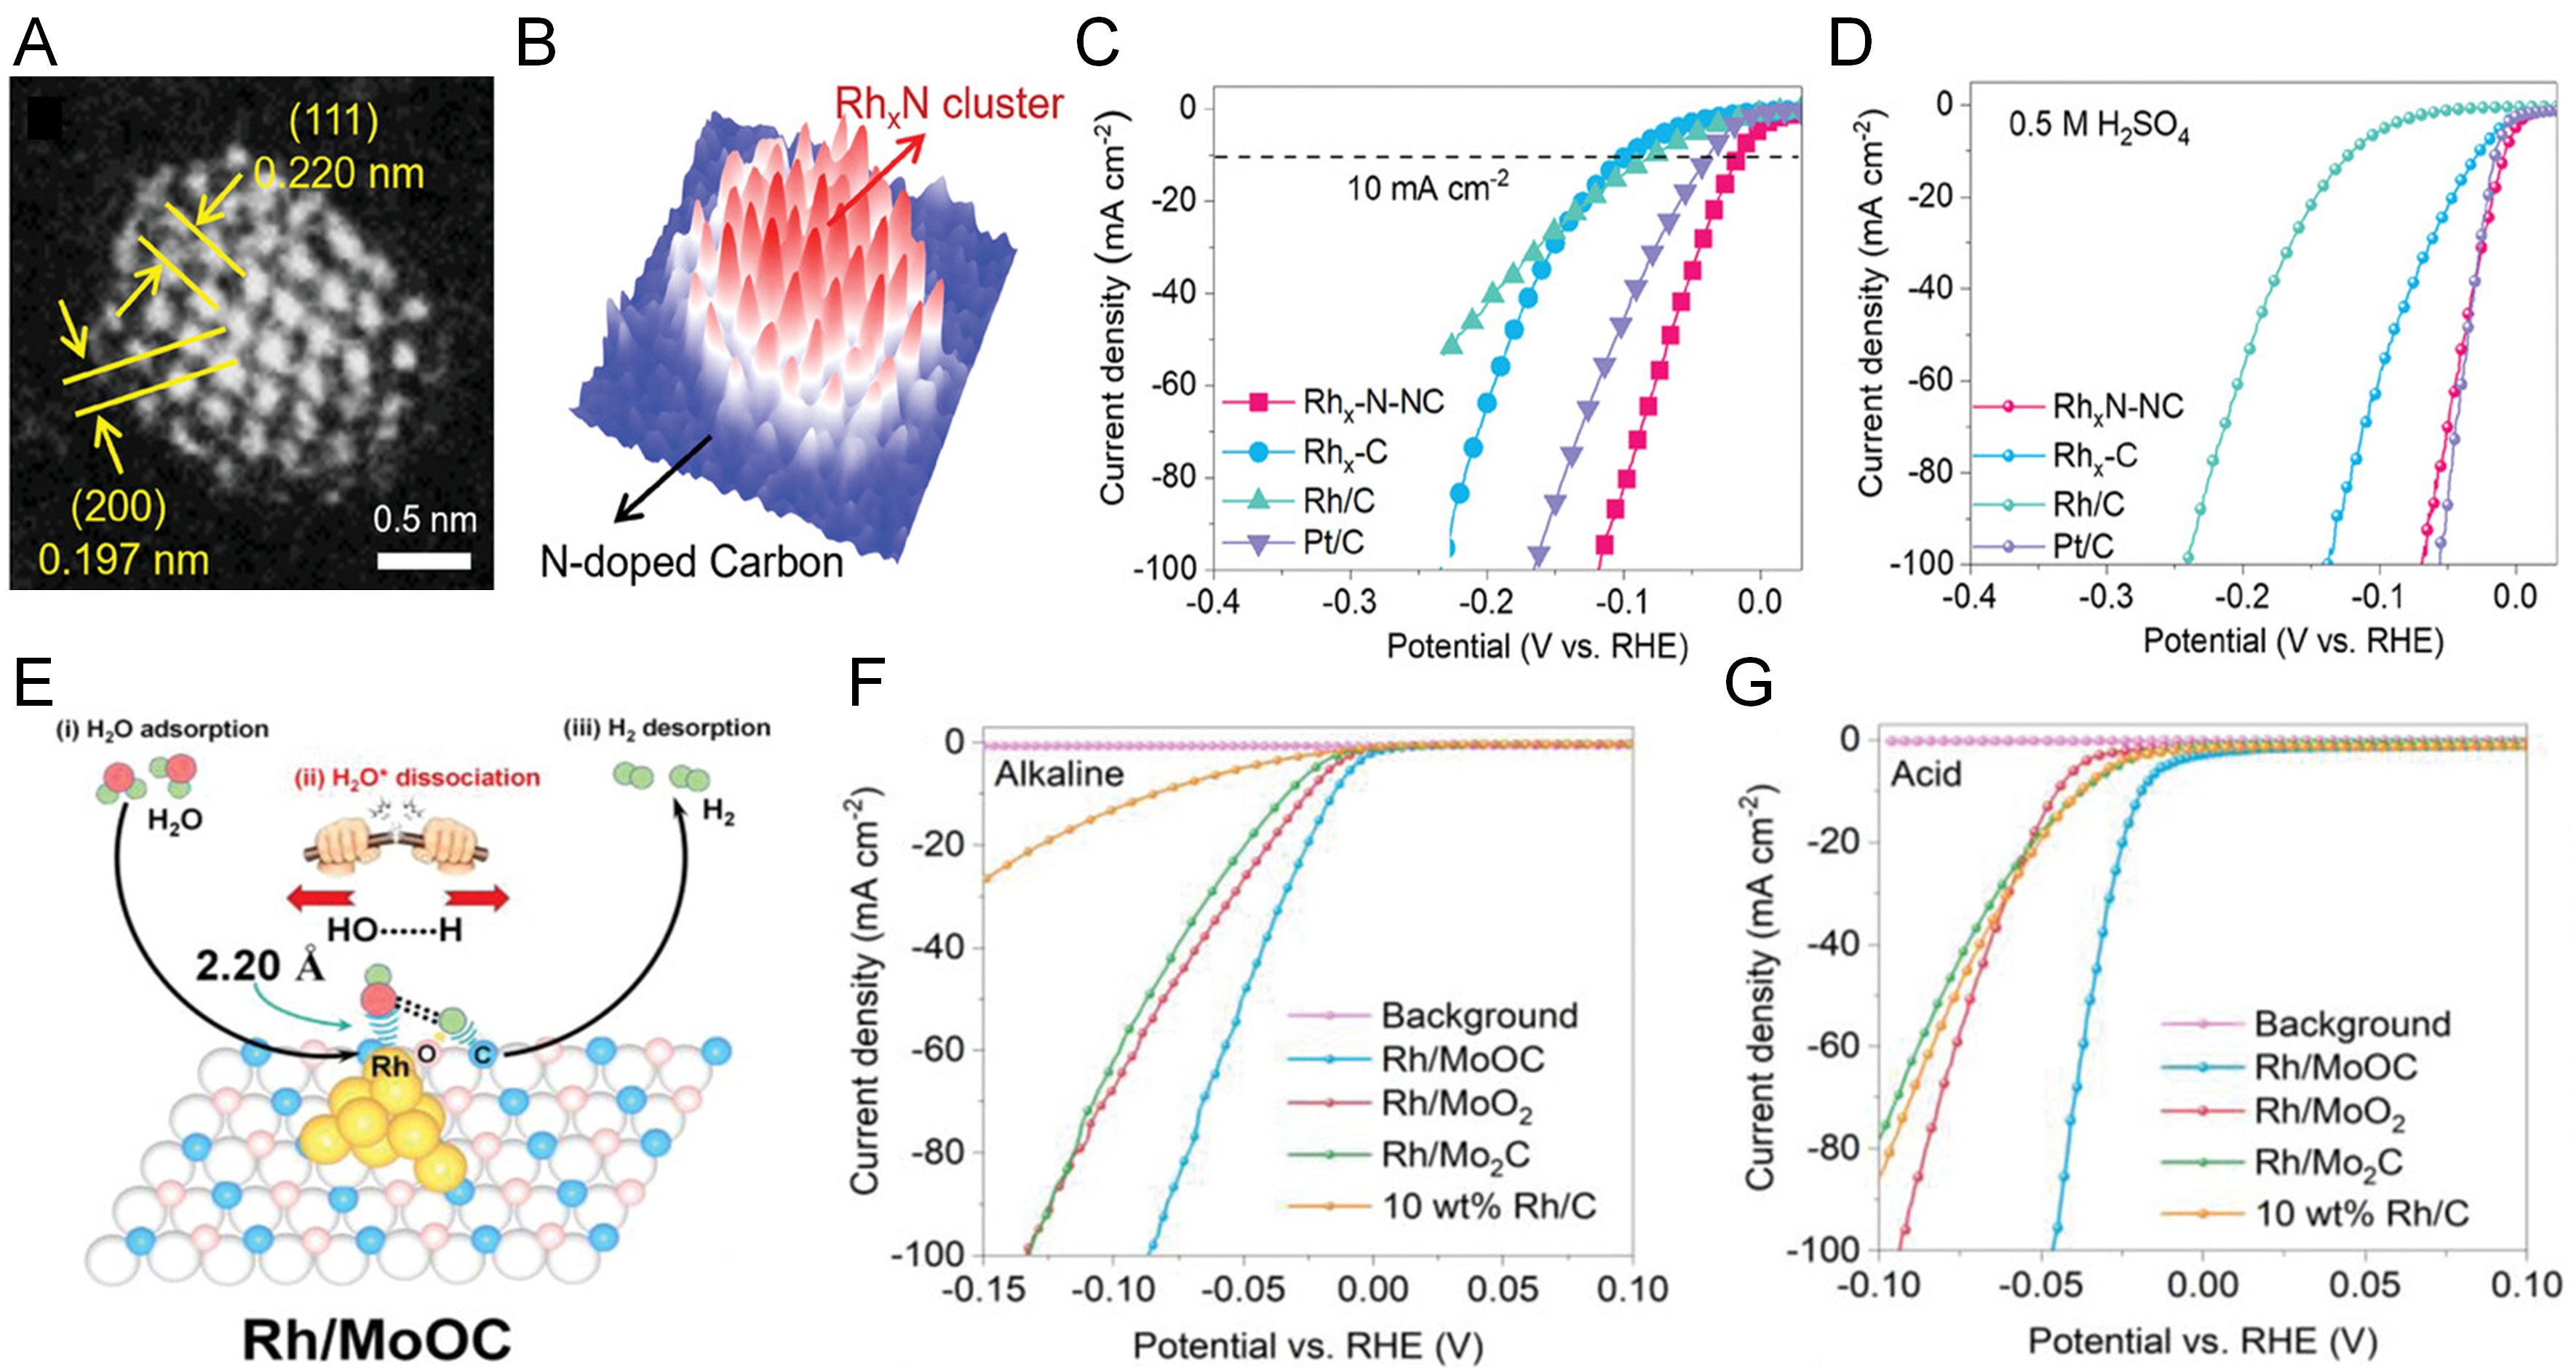
Figure 7. (A) HAADF-STEM images of RhxN-NC at different magnifications. (B) 3D intensity surface plot is shown for the Rh nanocluster in a. HER polarization curves of different catalysts in (C) 1.0 M KOH and (D) 0.5 M H2SO4. (A-D) are reproduced from Ref.[6]. with permission, Copyright 2023, Wiley. (E) Schematic illustration for alkaline HER by efficiently splitting the HO-H bond on Rh-C sites of MoOC with the O atom-tuned microenvironment and electronic structure. Performance of Rh/MoOC catalysts and control samples in a three-electrode configuration in (F) 1 M KOH and (G) 0.5 M H2SO4 at room temperature. (E-G) are reproduced from Ref.[41]. with permission, Copyright 2022, Wiley.


