


fig6
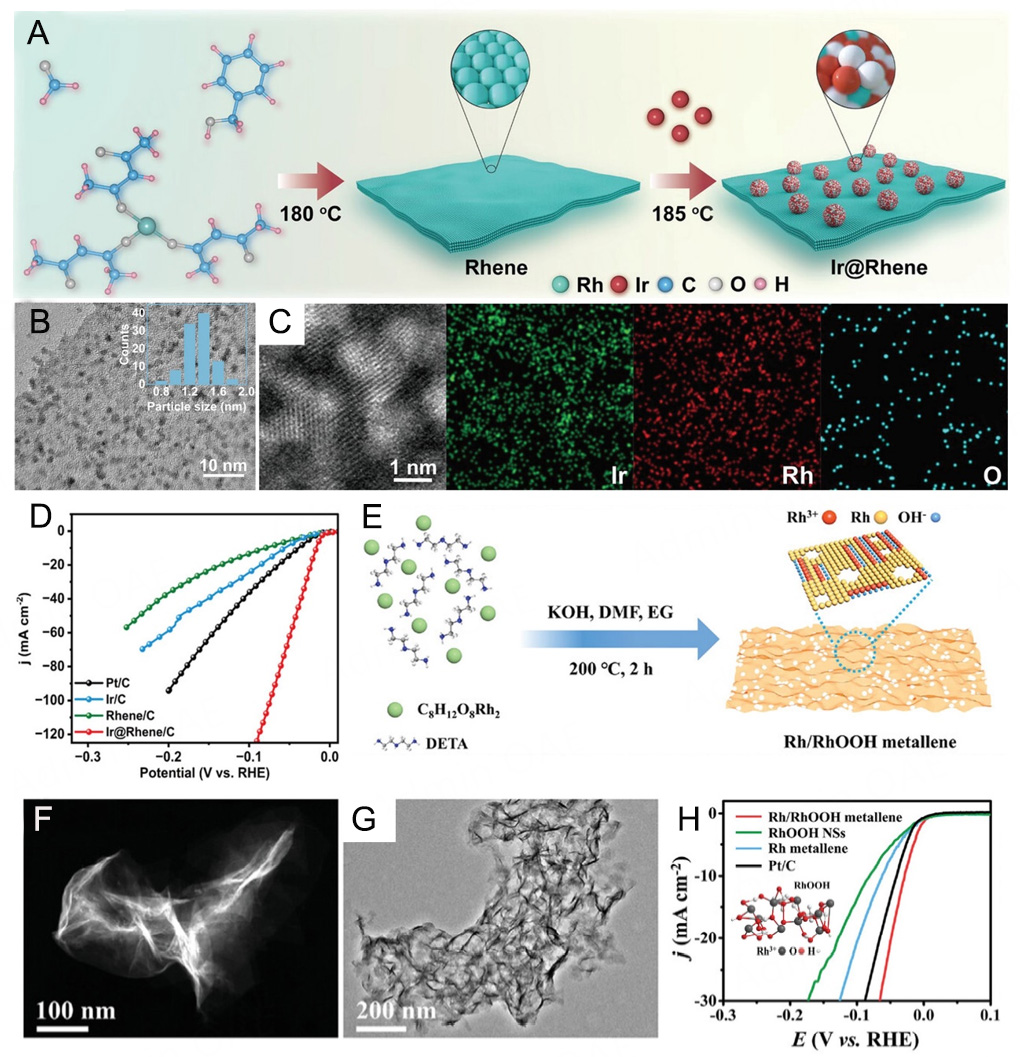
Figure 6. (A) Schematic diagram of the synthesis of Ir@Rhenes heterostructure, (B) typical low-magnification TEM image (inset: size distribution of the nanocluster), (C) HADDF-STEM-EDS elemental mapping images of Ir@Rhene heterostructure. (D) Polarization curves of Ir@Rhene/C, Rhene/C, and commercial Pt/C and Ir/C. (A-D) are reproduced from Ref.[15]. with permission, Copyright 2023, Wiley. (E) Schematic diagram of the synthesis process for the Rh/RhOOH metallene. (F) Low and high-magnification HAADF-STEM image and (G) low-magnification TEM image of the Rh/RhOOH metallene. (H) HER polarization curves for various electrocatalysts. Inset: local ball-and-stick model of RhOOH. (E-H) are reproduced from Ref.[76]. with permission, Copyright 2022, Wiley.


