


fig3
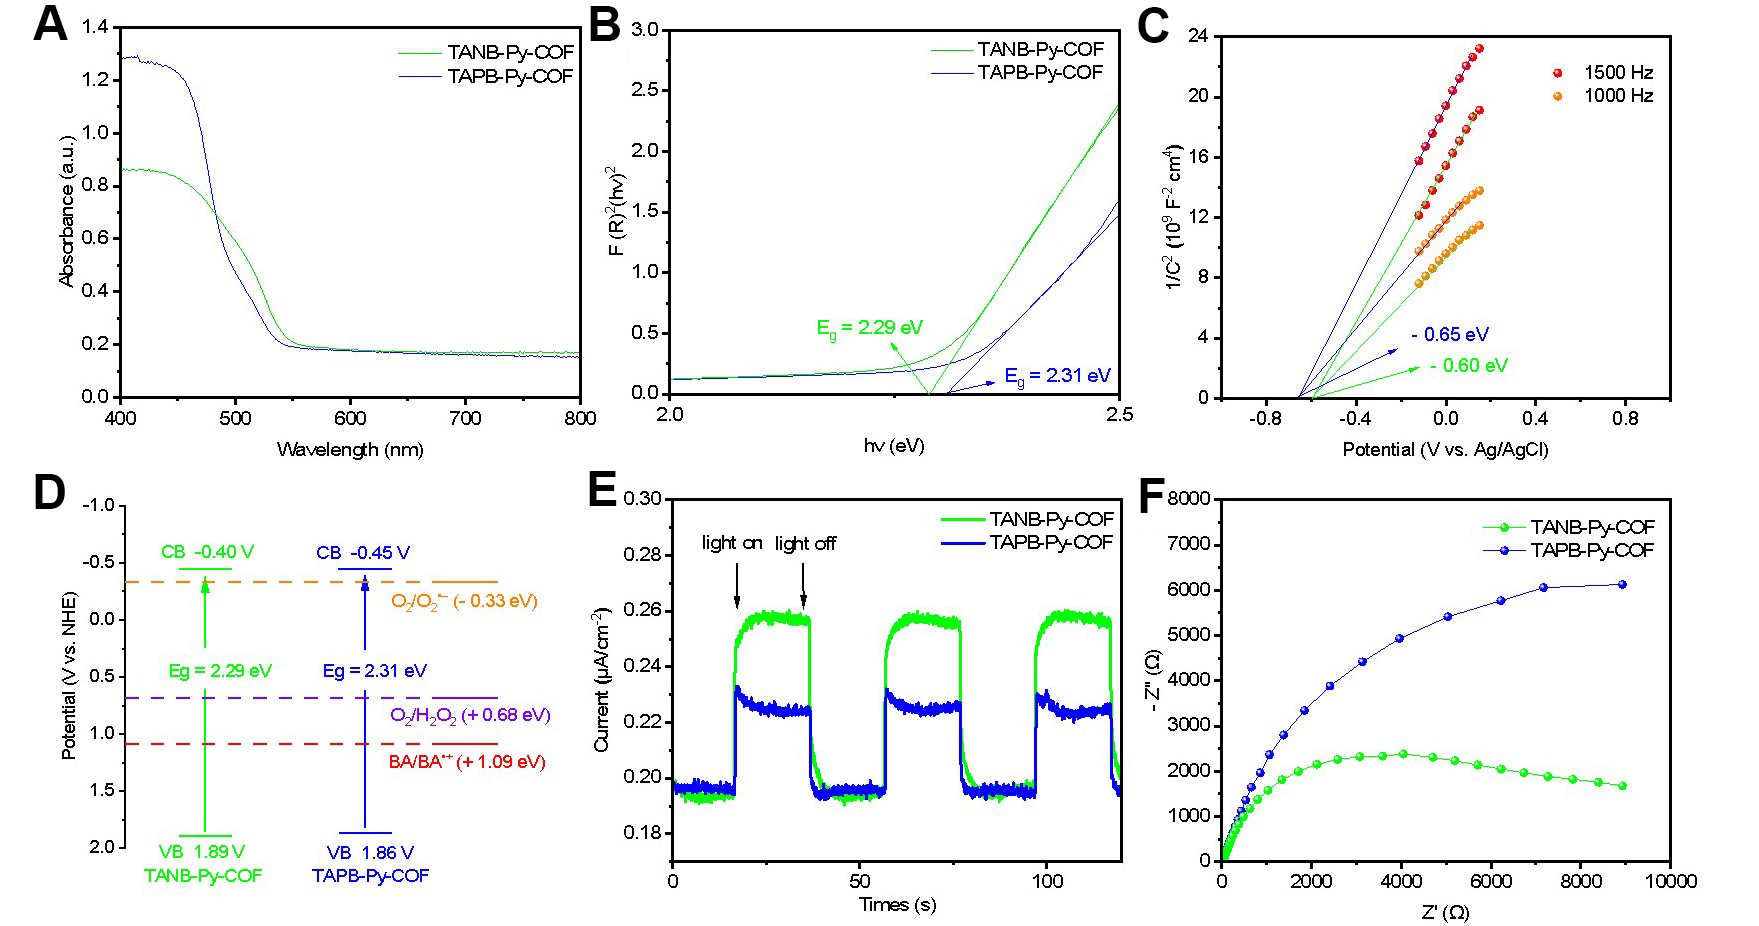
Figure 3. The photoelectrochemical measurements of TANB-Py-COF (green line) and TAPB-Py-COF (blue line). (A) UV/Vis diffuse reflectance spectroscopy; (B) Tauc plots; (C) Mott-Schottky plots; (D) Band structure diagram as determined from Mott-Schottky plots and UV-DRS; (E) Transient photocurrent measurements; (F) EIS Nyquist plots. COF: Covalent organic framework; UV/Vis: ultraviolet/visible; DRS: diffuse reflectance spectroscopy; EIS: electrochemical impedance spectroscopy.


