


fig8
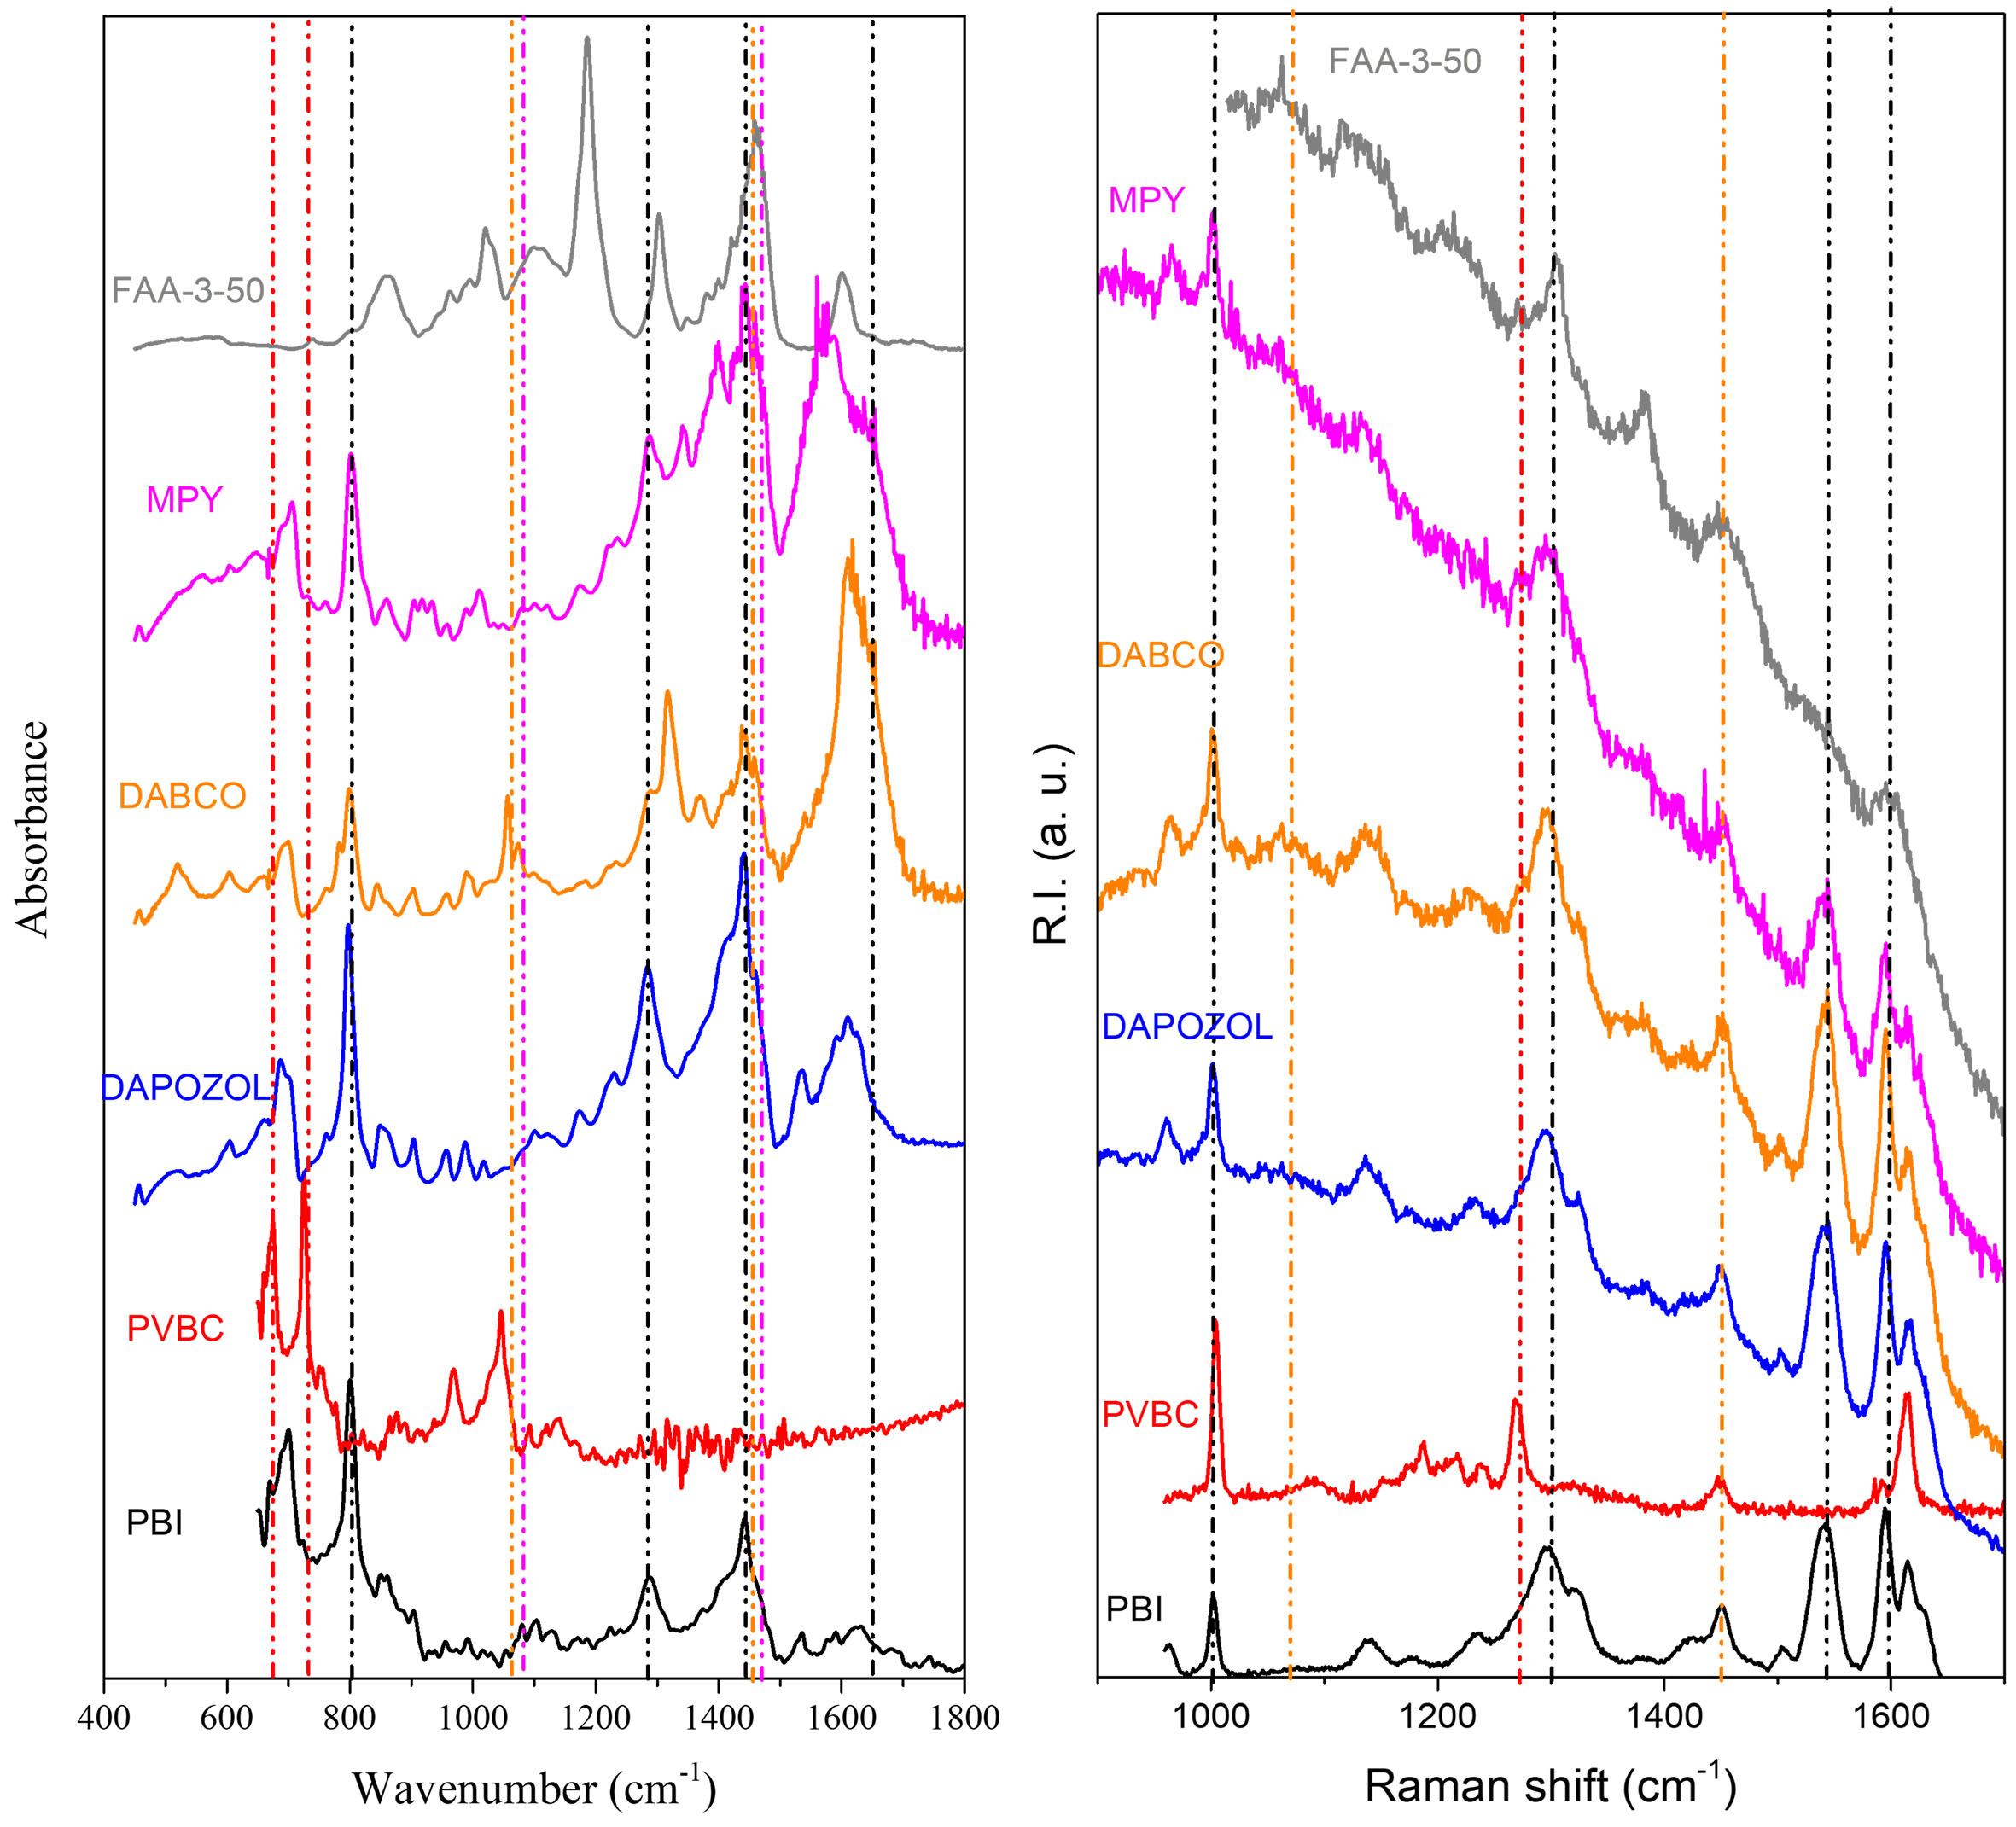
Figure 8. FTIR (left) and Raman (right) spectra of the DABCO, MPY, FAA-3-50, and Dapozol M-40 membranes. Pure PBI and PVBC polymers are included for clarity. Note: Color-coded dotted lines indicate main bands for (1) PBI (black), (2) PVBC (red), (3) DABCO (orange), and (4) MPY (magenta).


