


fig5
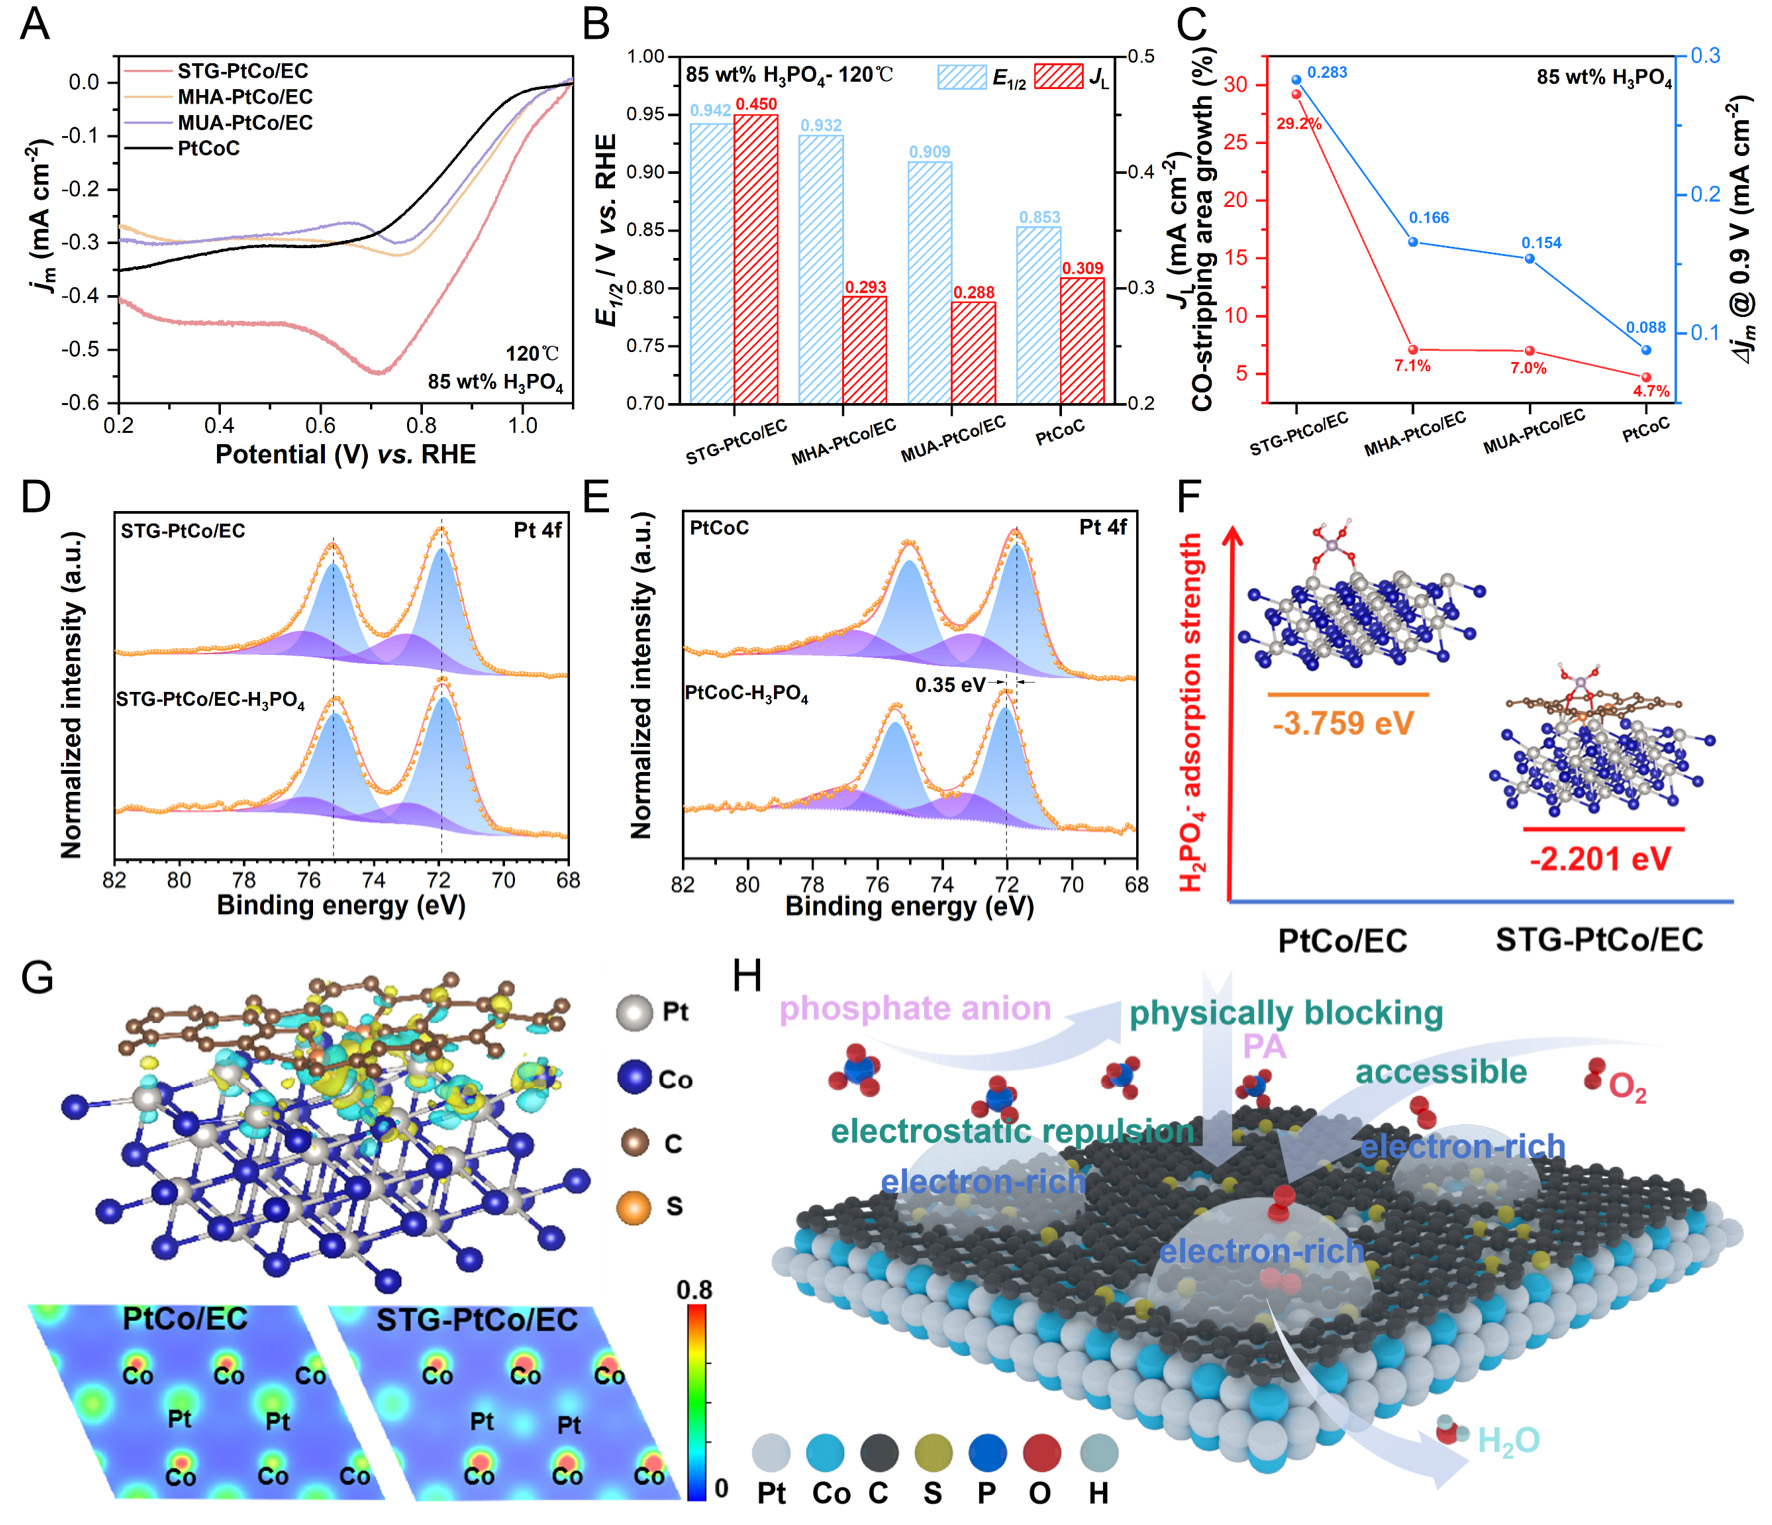
Figure 5. (A) ORR polarization curves of the synthesized catalysts and commercial PtCoC in O2-saturated 85 wt% H3PO4 at 120 °C. (B) Comparison of E1/2 and JL of the catalysts in 85 wt% H3PO4 at 120 °C. (C) Relationship between the CO-stripping area growth and Δjm @ 0.9 V as the testing temperature increases from 25 °C to 120 °C in 85 wt% H3PO4. Pt 4f XPS spectra of (D) STG-PtCo/EC and (E) commercial PtCoC before and after being treated with 85 wt% H3PO4 at 160 °C for 18 h. (F) Geometric structure and adsorption strength of H2PO4- on the PtCo (111) surface of PtCo/EC and STG-PtCo/EC. (G) The differential charge density map of the STG-PtCo/EC samples (the yellow and green represent regions of electron accumulation and depletion, respectively) and the charge density maps of PtCo/EC and STG-PtCo/EC. (H) Schematic diagram of S-doped CELs assisting PtCo in resisting H2PO4- adsorption.


