


fig4
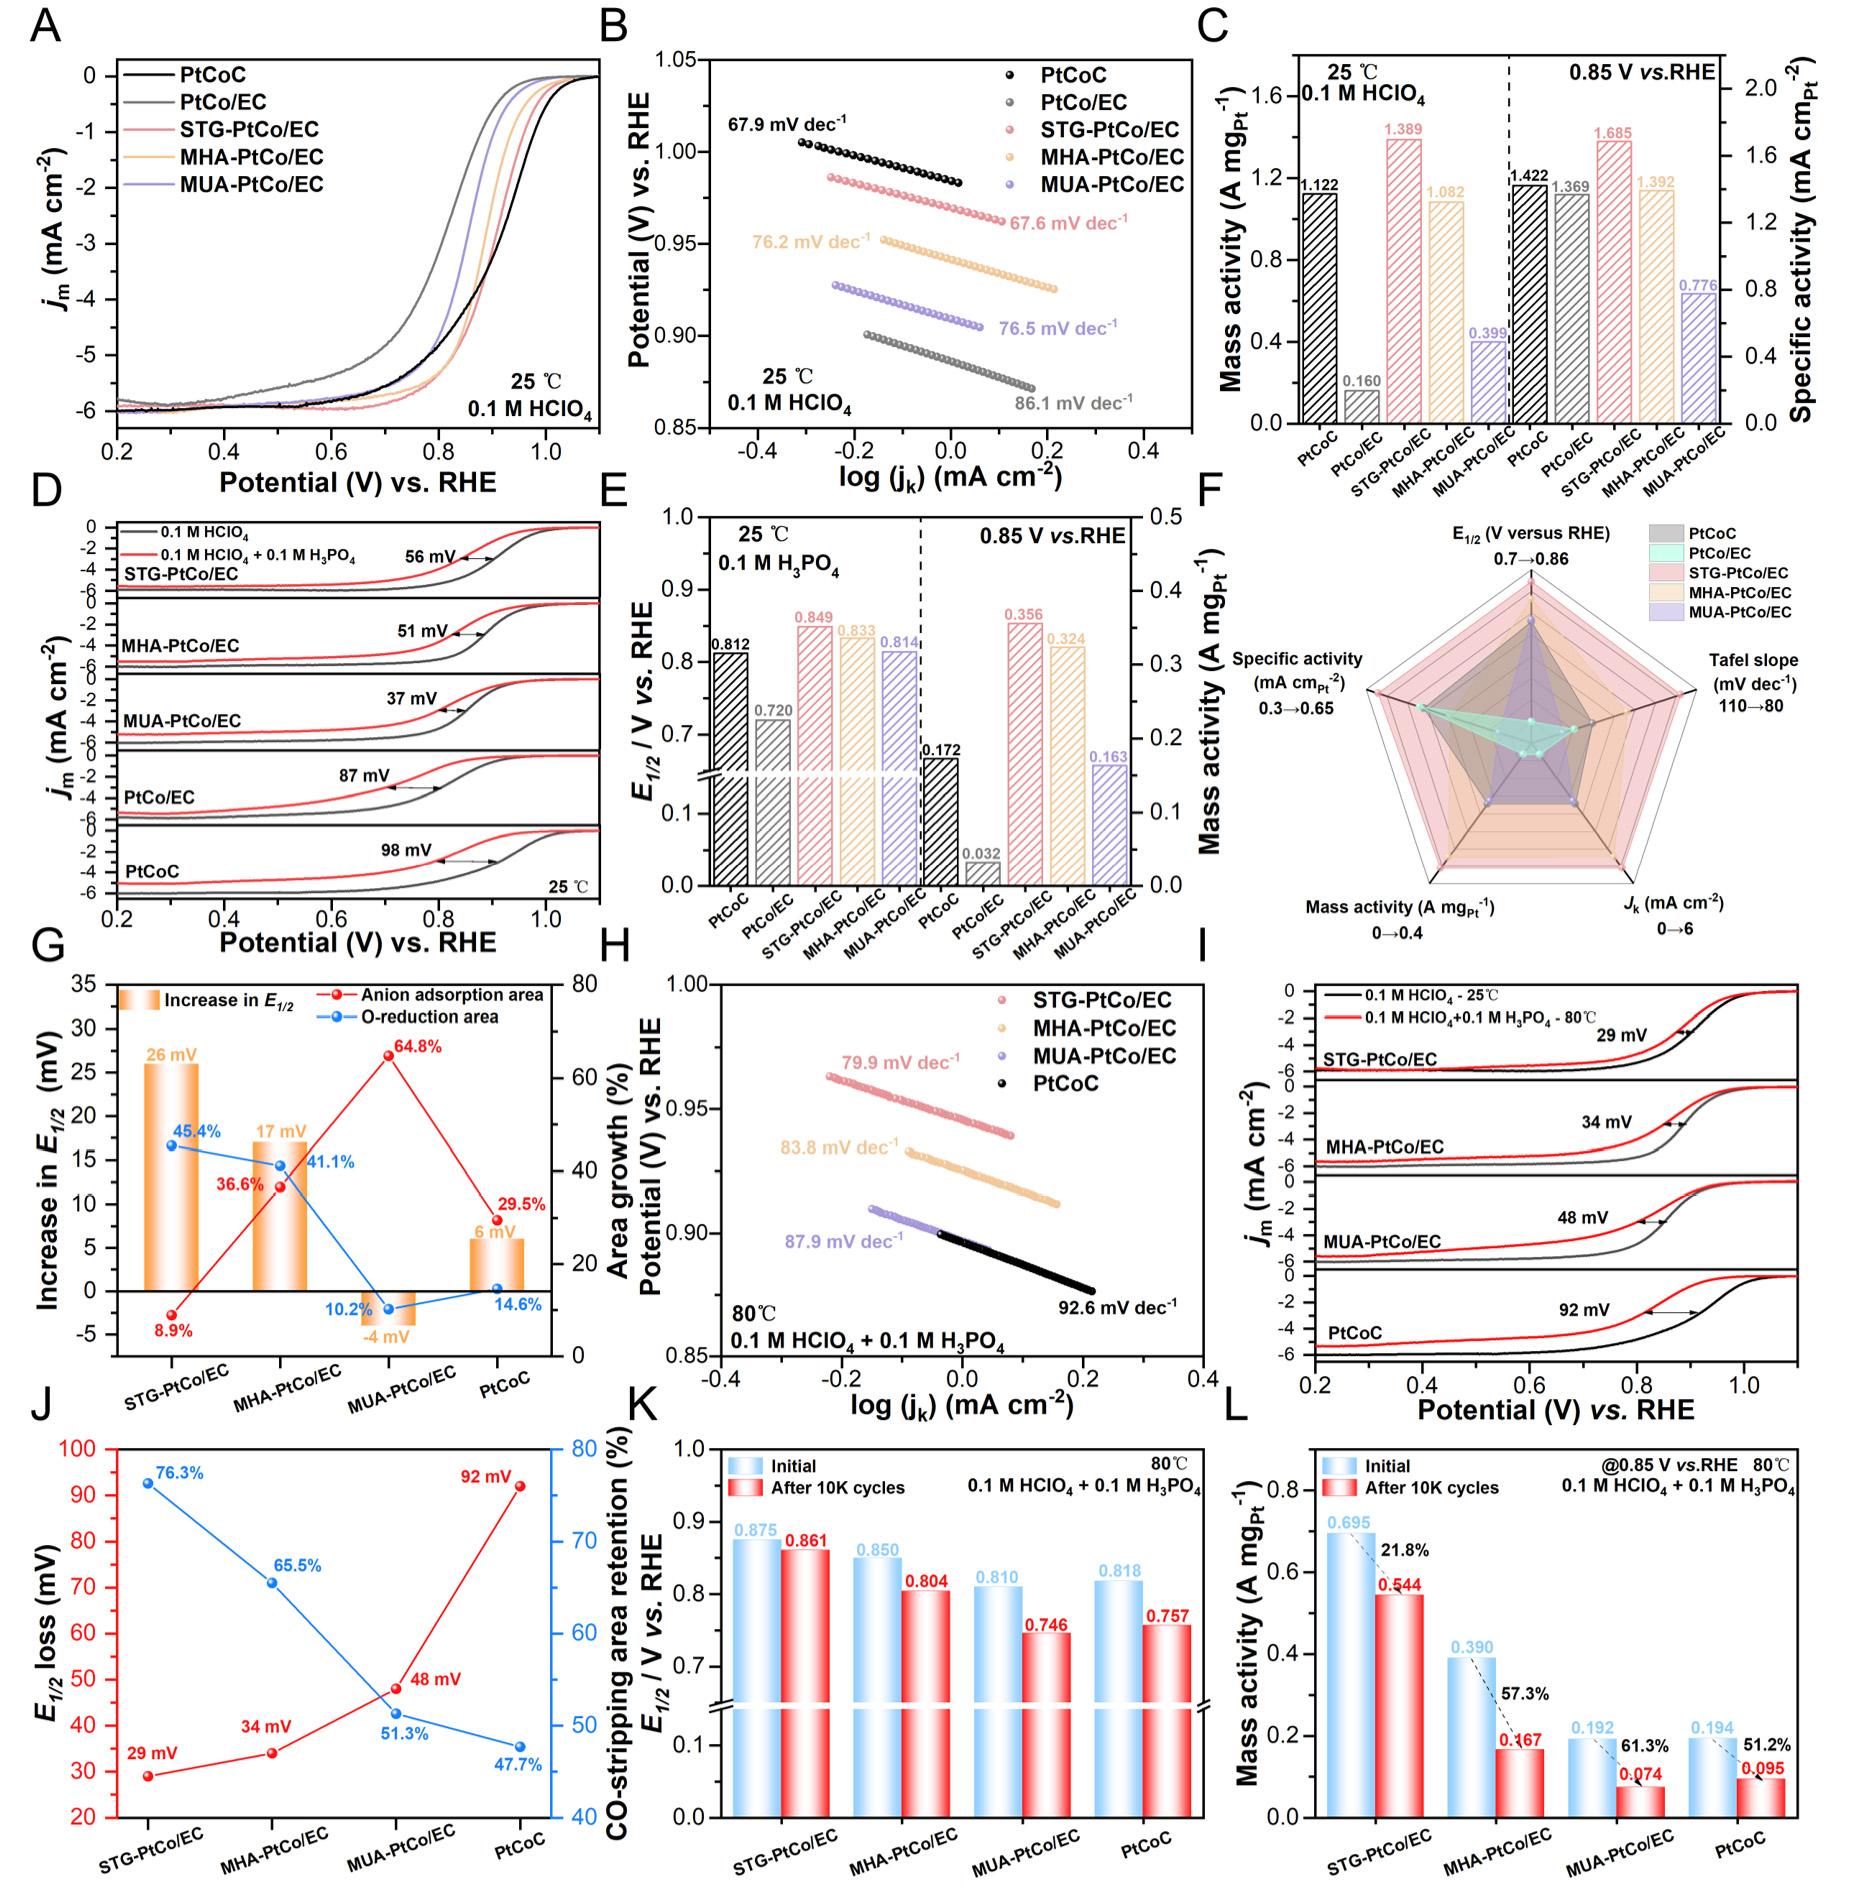
Figure 4. (A) ORR polarization curves and (B) Tafel plots of the synthesized catalysts and commercial PtCoC in O2-saturated 0.1 M HClO4 at 25 °C. (C) The MA and SA of the synthesized catalysts at 0.85 V vs. RHE in O2-saturated 0.1 M HClO4 at 25 °C. (D) ORR polarization curves comparison, (E) E1/2 and MA comparison in 0.1 M HClO4 and 0.1 M HClO4 + 0.1 M H3PO4 at 25 °C. (F) Radar chart of ORR performance for the synthesized catalysts in 0.1 M HClO4 + 0.1 M H3PO4 at 25 °C. (G) Correlation among phosphate anion coverage, O-reduction area, and the increment in E1/2 for the synthesized catalysts as the testing temperature increases from 25 °C to 80 °C in 0.1 M HClO4 + 0.1 M H3PO4. (H) Tafel Slopes in 0.1 M HClO4 + 0.1 M H3PO4 at 80 °C. (I) ORR polarization curves comparison in 0.1 M HClO4 at 25 °C and 0.1 M HClO4 + 0.1 M H3PO4 at 80 °C. (J) Correlation of the E1/2 decay values and CO-stripping area retention in 0.1 M HClO4 at 25 °C and in 0.1 M HClO4 + 0.1 M H3PO4 at 80 °C, Retention% = (value in 0.1 M HClO4 + 0.1 M H3PO4/value in 0.1 M HClO4) × 100%. (K) Comparison of E1/2 and (L) MA of the synthesized catalysts after 10,000 potential cycles in 0.1 M HClO4 + 0.1 M H3PO4 at 80 °C.


