


fig3
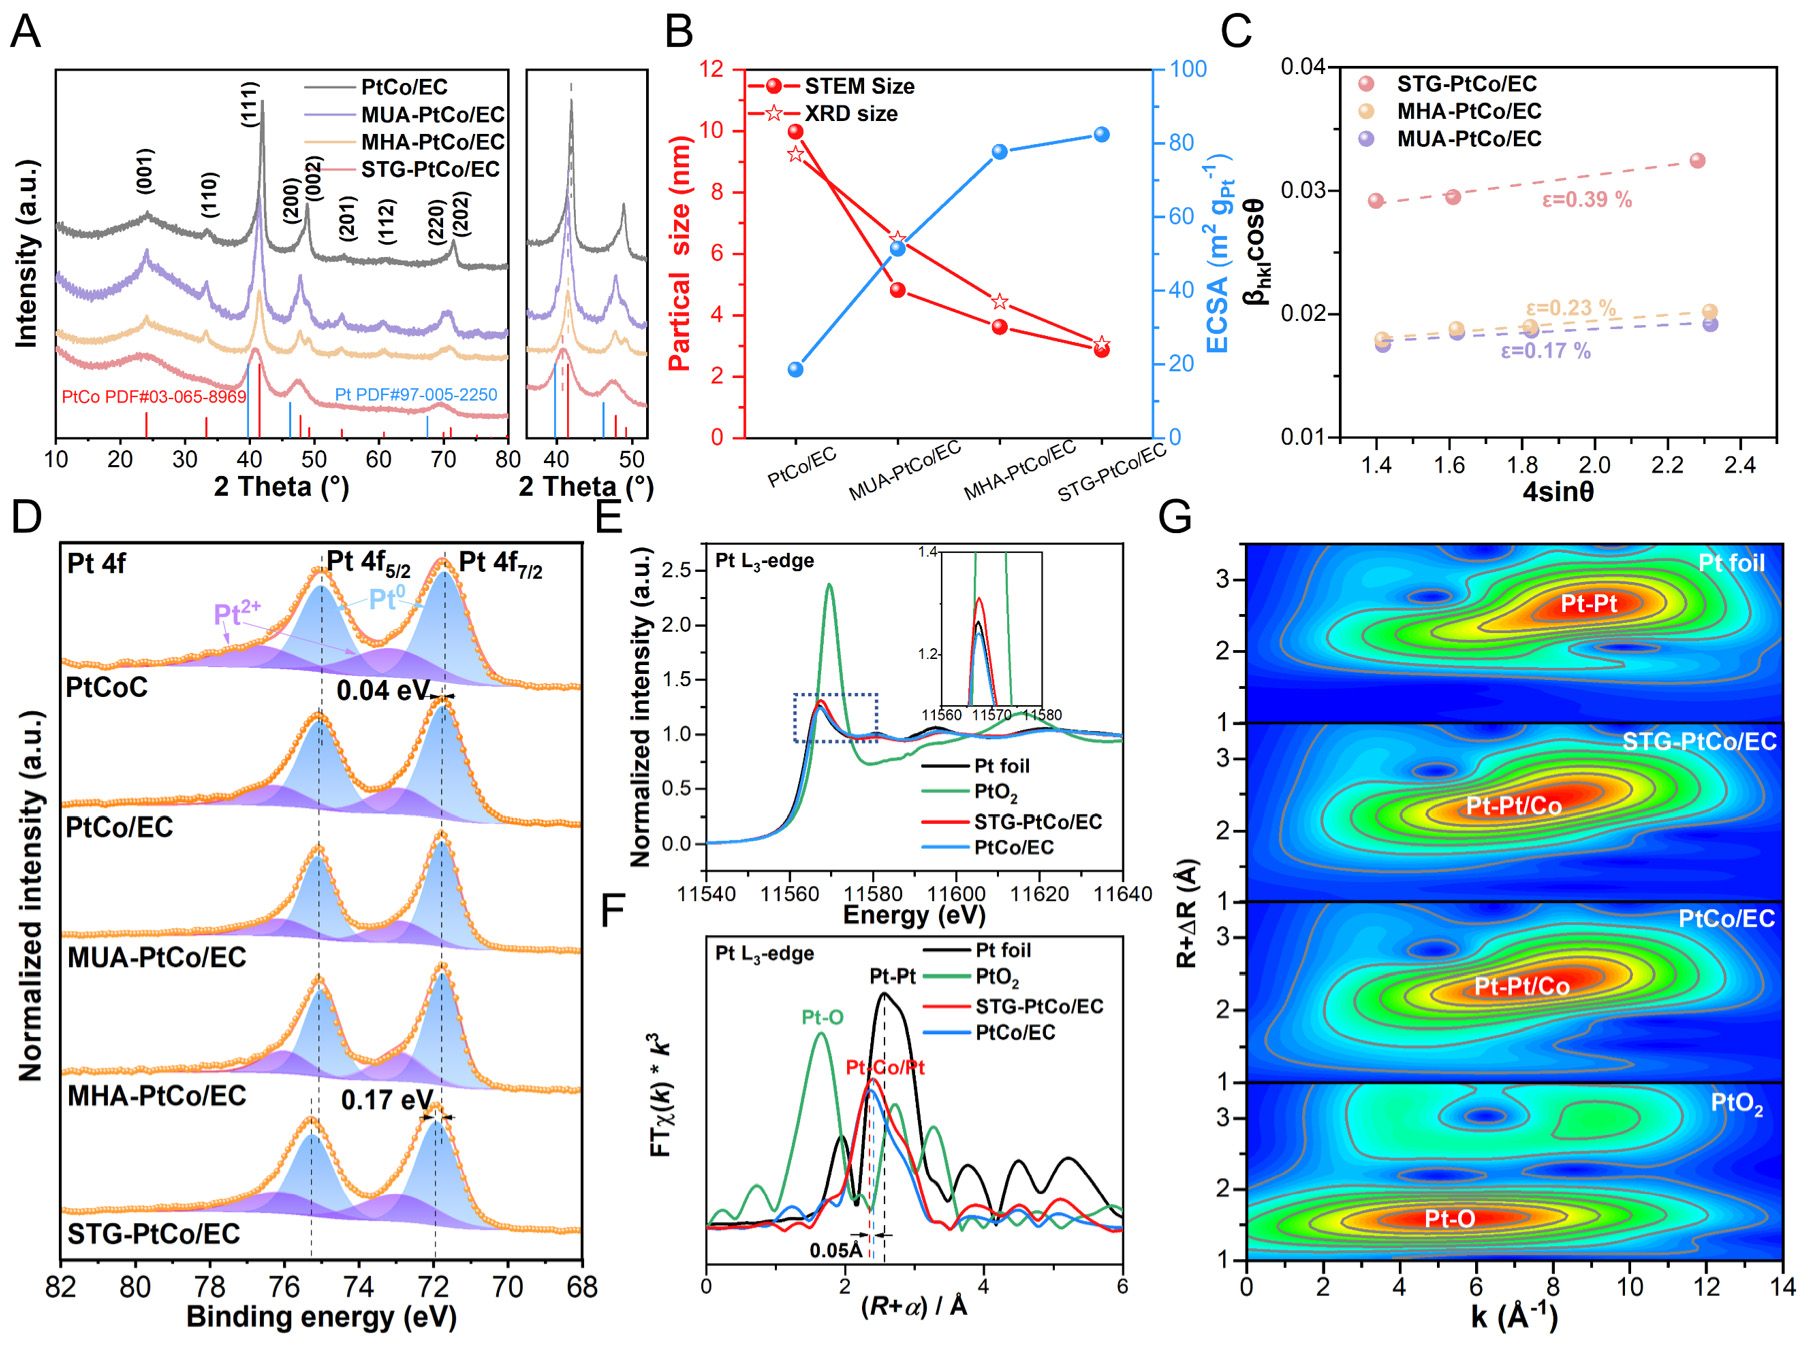
Figure 3. (A) XRD patterns. (B) Relationship between particle size and ECSA. (C) Estimated lattice strain (ε) from the Williamson-Hall plots. (D) XPS spectra of Pt 4f of the as-prepared samples. (E) Normalized XANES spectra, (F) Fourier-transformed EXAFS spectra and (G) Wavelet transform spectrum of Pt L3-edge.


