


fig5
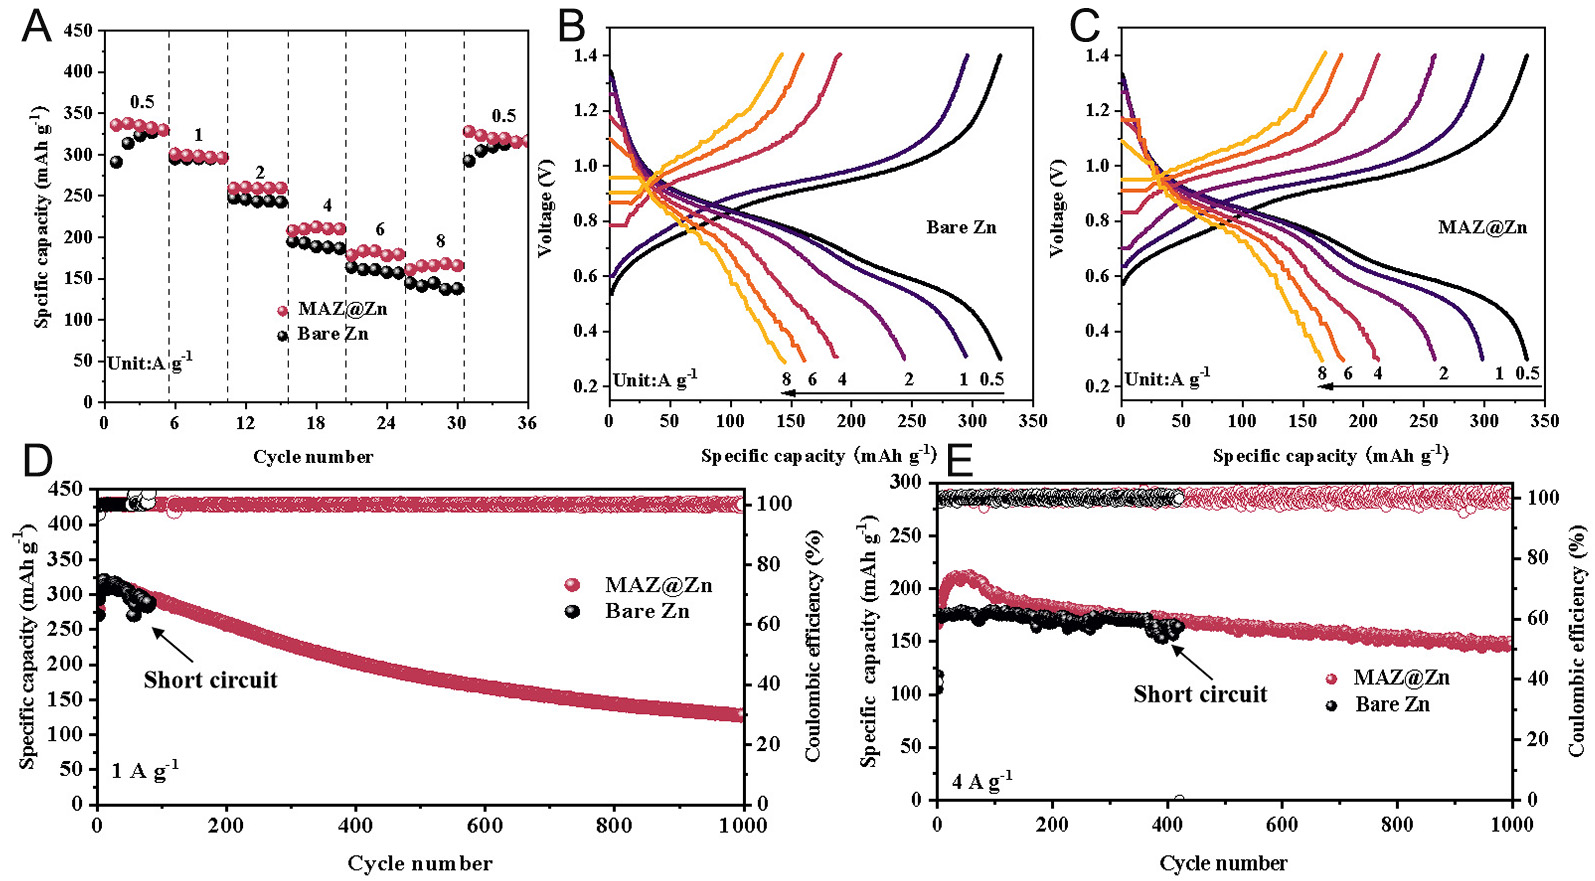
Figure 5. Comparison of electrochemical performance between bare Zn//NVO and MAZ@Zn//NVO batteries. (A) Rate performance (charge-discharge curves at a current density from 0.5 A g-1 to 8 A g-1); GCD curves of (B) bare Zn//NVO; (C) MAZ@Zn//NVO; (D) cycling test at 1 A g-1; (E) cycling test at 4 A g-1.


