


fig3
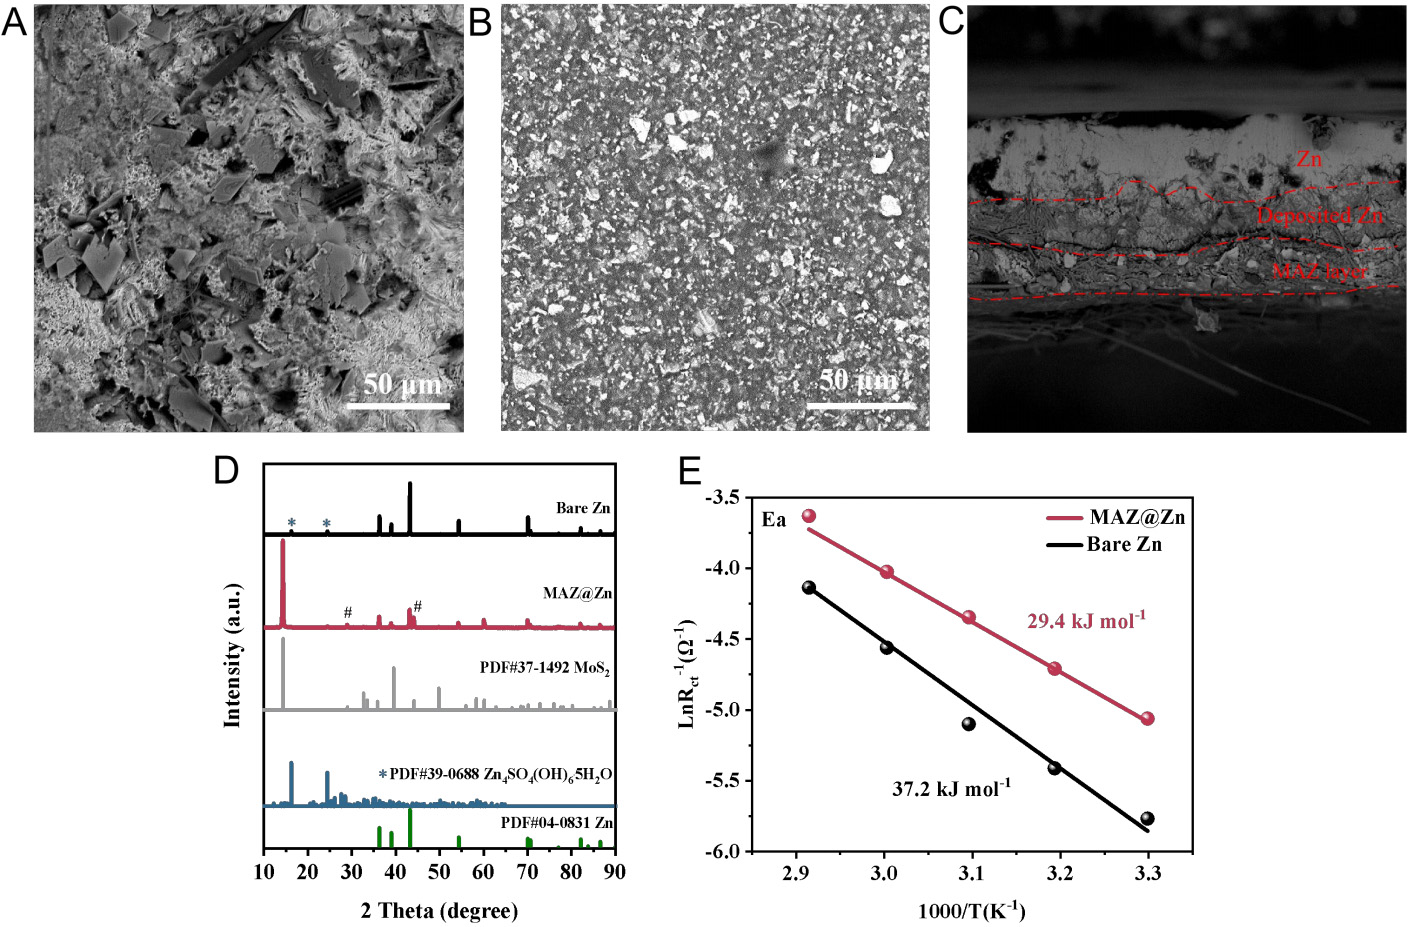
Figure 3. Structural and electrochemical analysis of Zn-based cells. SEM images of (A) bare Zn, (B) the top surface, and (C) the cross-section of MAZ@Zn in symmetric cells after 50 cycles at 1 mA cm-2 (1 mAh cm-2). (D) XRD patterns of bare Zn and MAZ@Zn in symmetric cells after 50 cycles at 1 mA cm-2 (1 mAh cm-2); (E) Corresponding Arrhenius plots and comparison of activation energies between bare Zn and MAZ@Zn.


