


fig2
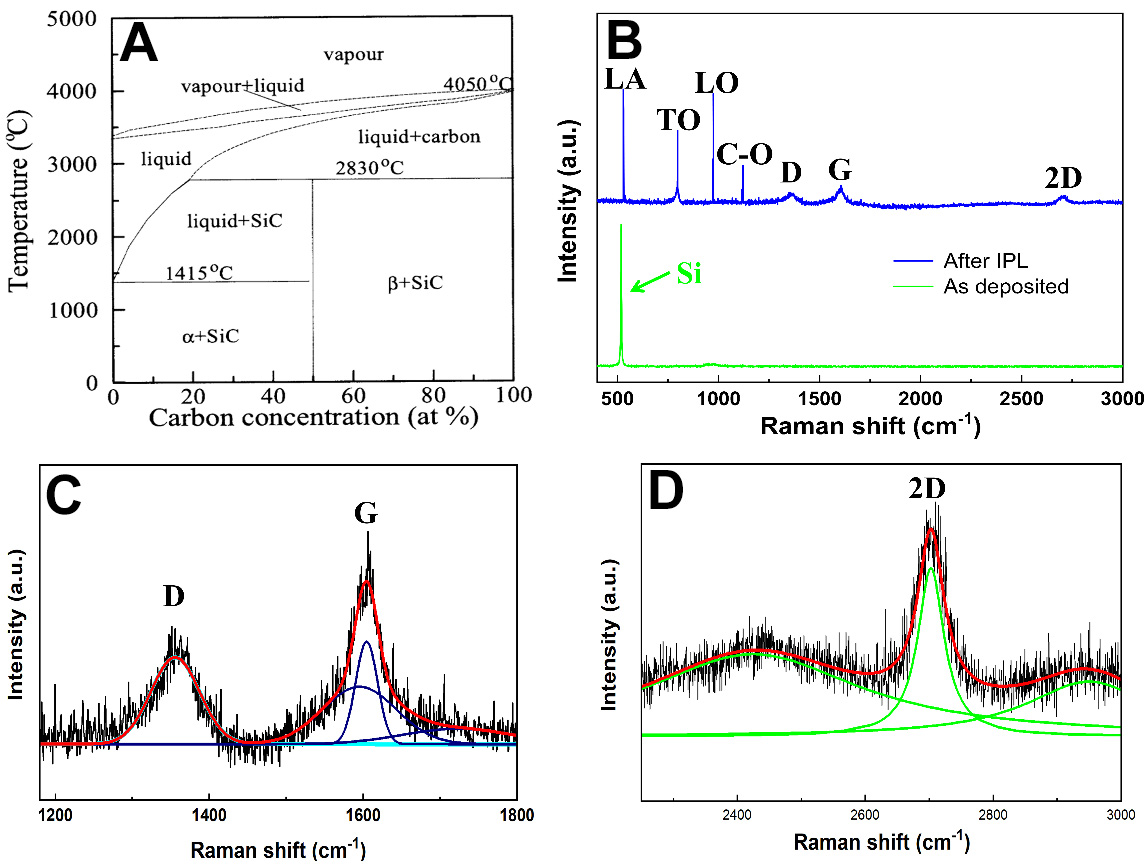
Figure 2. (A) Equilibrium phase diagram of the carbon-silicon system[14], Copyright © 1969, Springer; (B) Raman spectrum acquired from the graphene embedded 3C-SiC nanocrystal; (C) fit of D and G peaks (three Gaussians) and (D) fit of 2D peak (one Lorentzian).


