


fig1
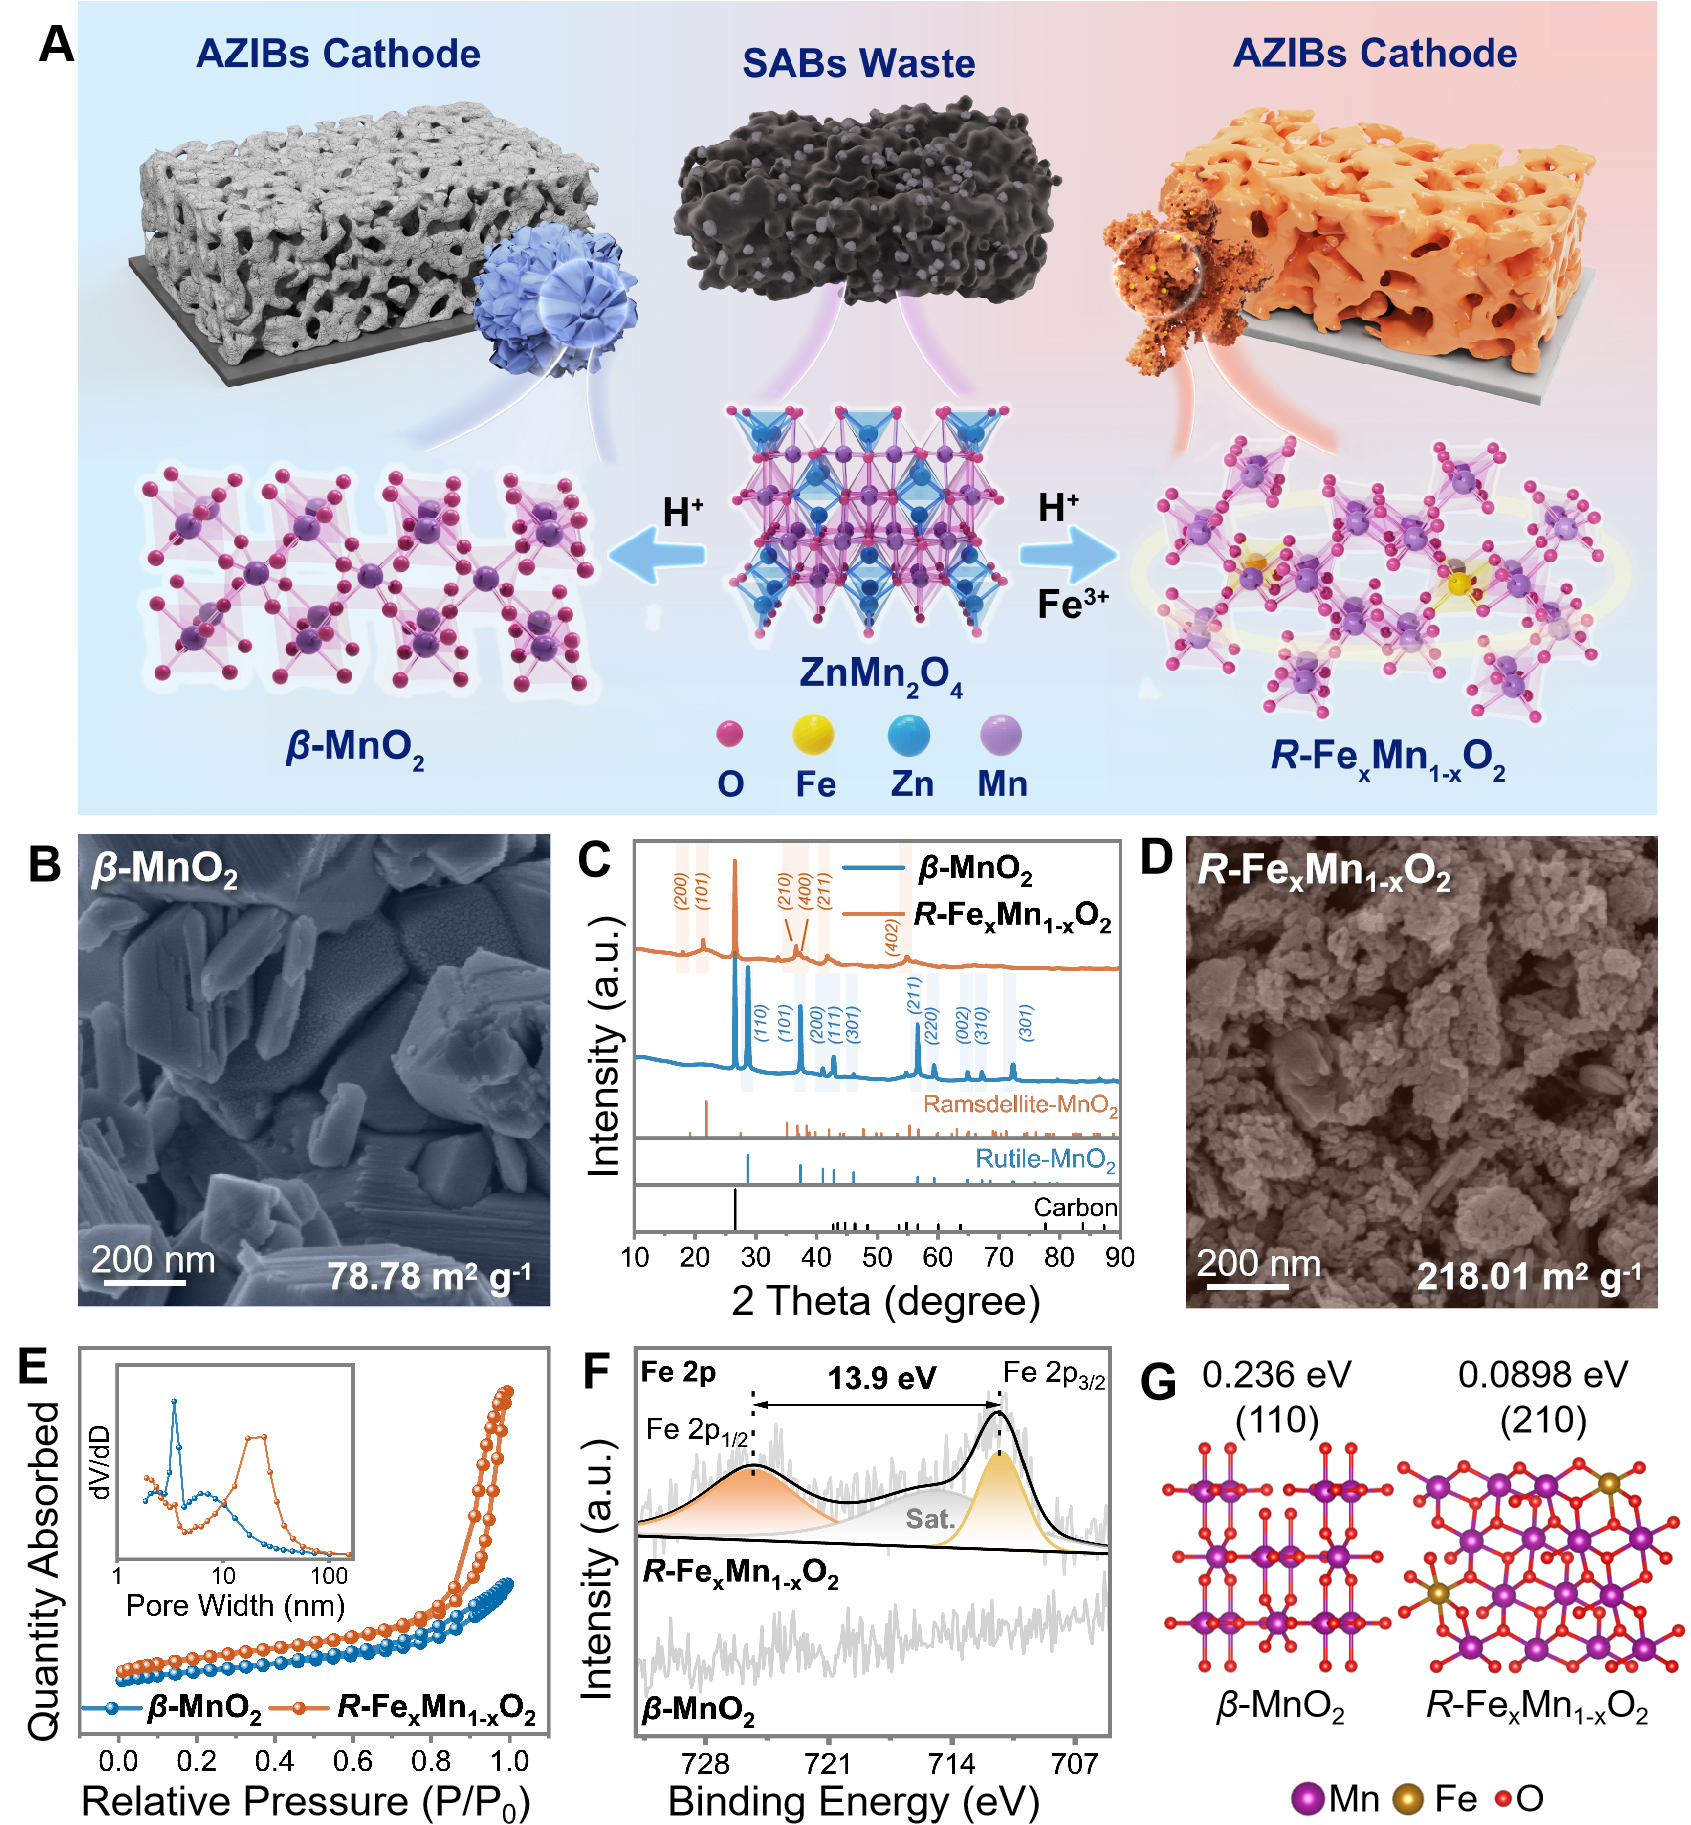
Figure 1. (A) Schematic illustration of the phase evolutions from SABs to β-MnO2 and R-FexMn1-xO2; SEM image and BET surface area of (B) β-MnO2 and (D) R-FexMn1-xO2 (x≈3 wt.%); (C) XRD patterns; (E) N2 adsorption/desorption isotherms and corresponding pore size distributions (inset); (F) Fe 2p XPS spectra; (G) Surface morphology and surface quantities of the pristine surface. SEM: Scanning electron microscopy; BET: brunauer-emmett-teller; XPS: X-ray photoelectron spectrometer; SABs: spent alkaline batteries; XRD: X-ray diffraction.


