


fig4
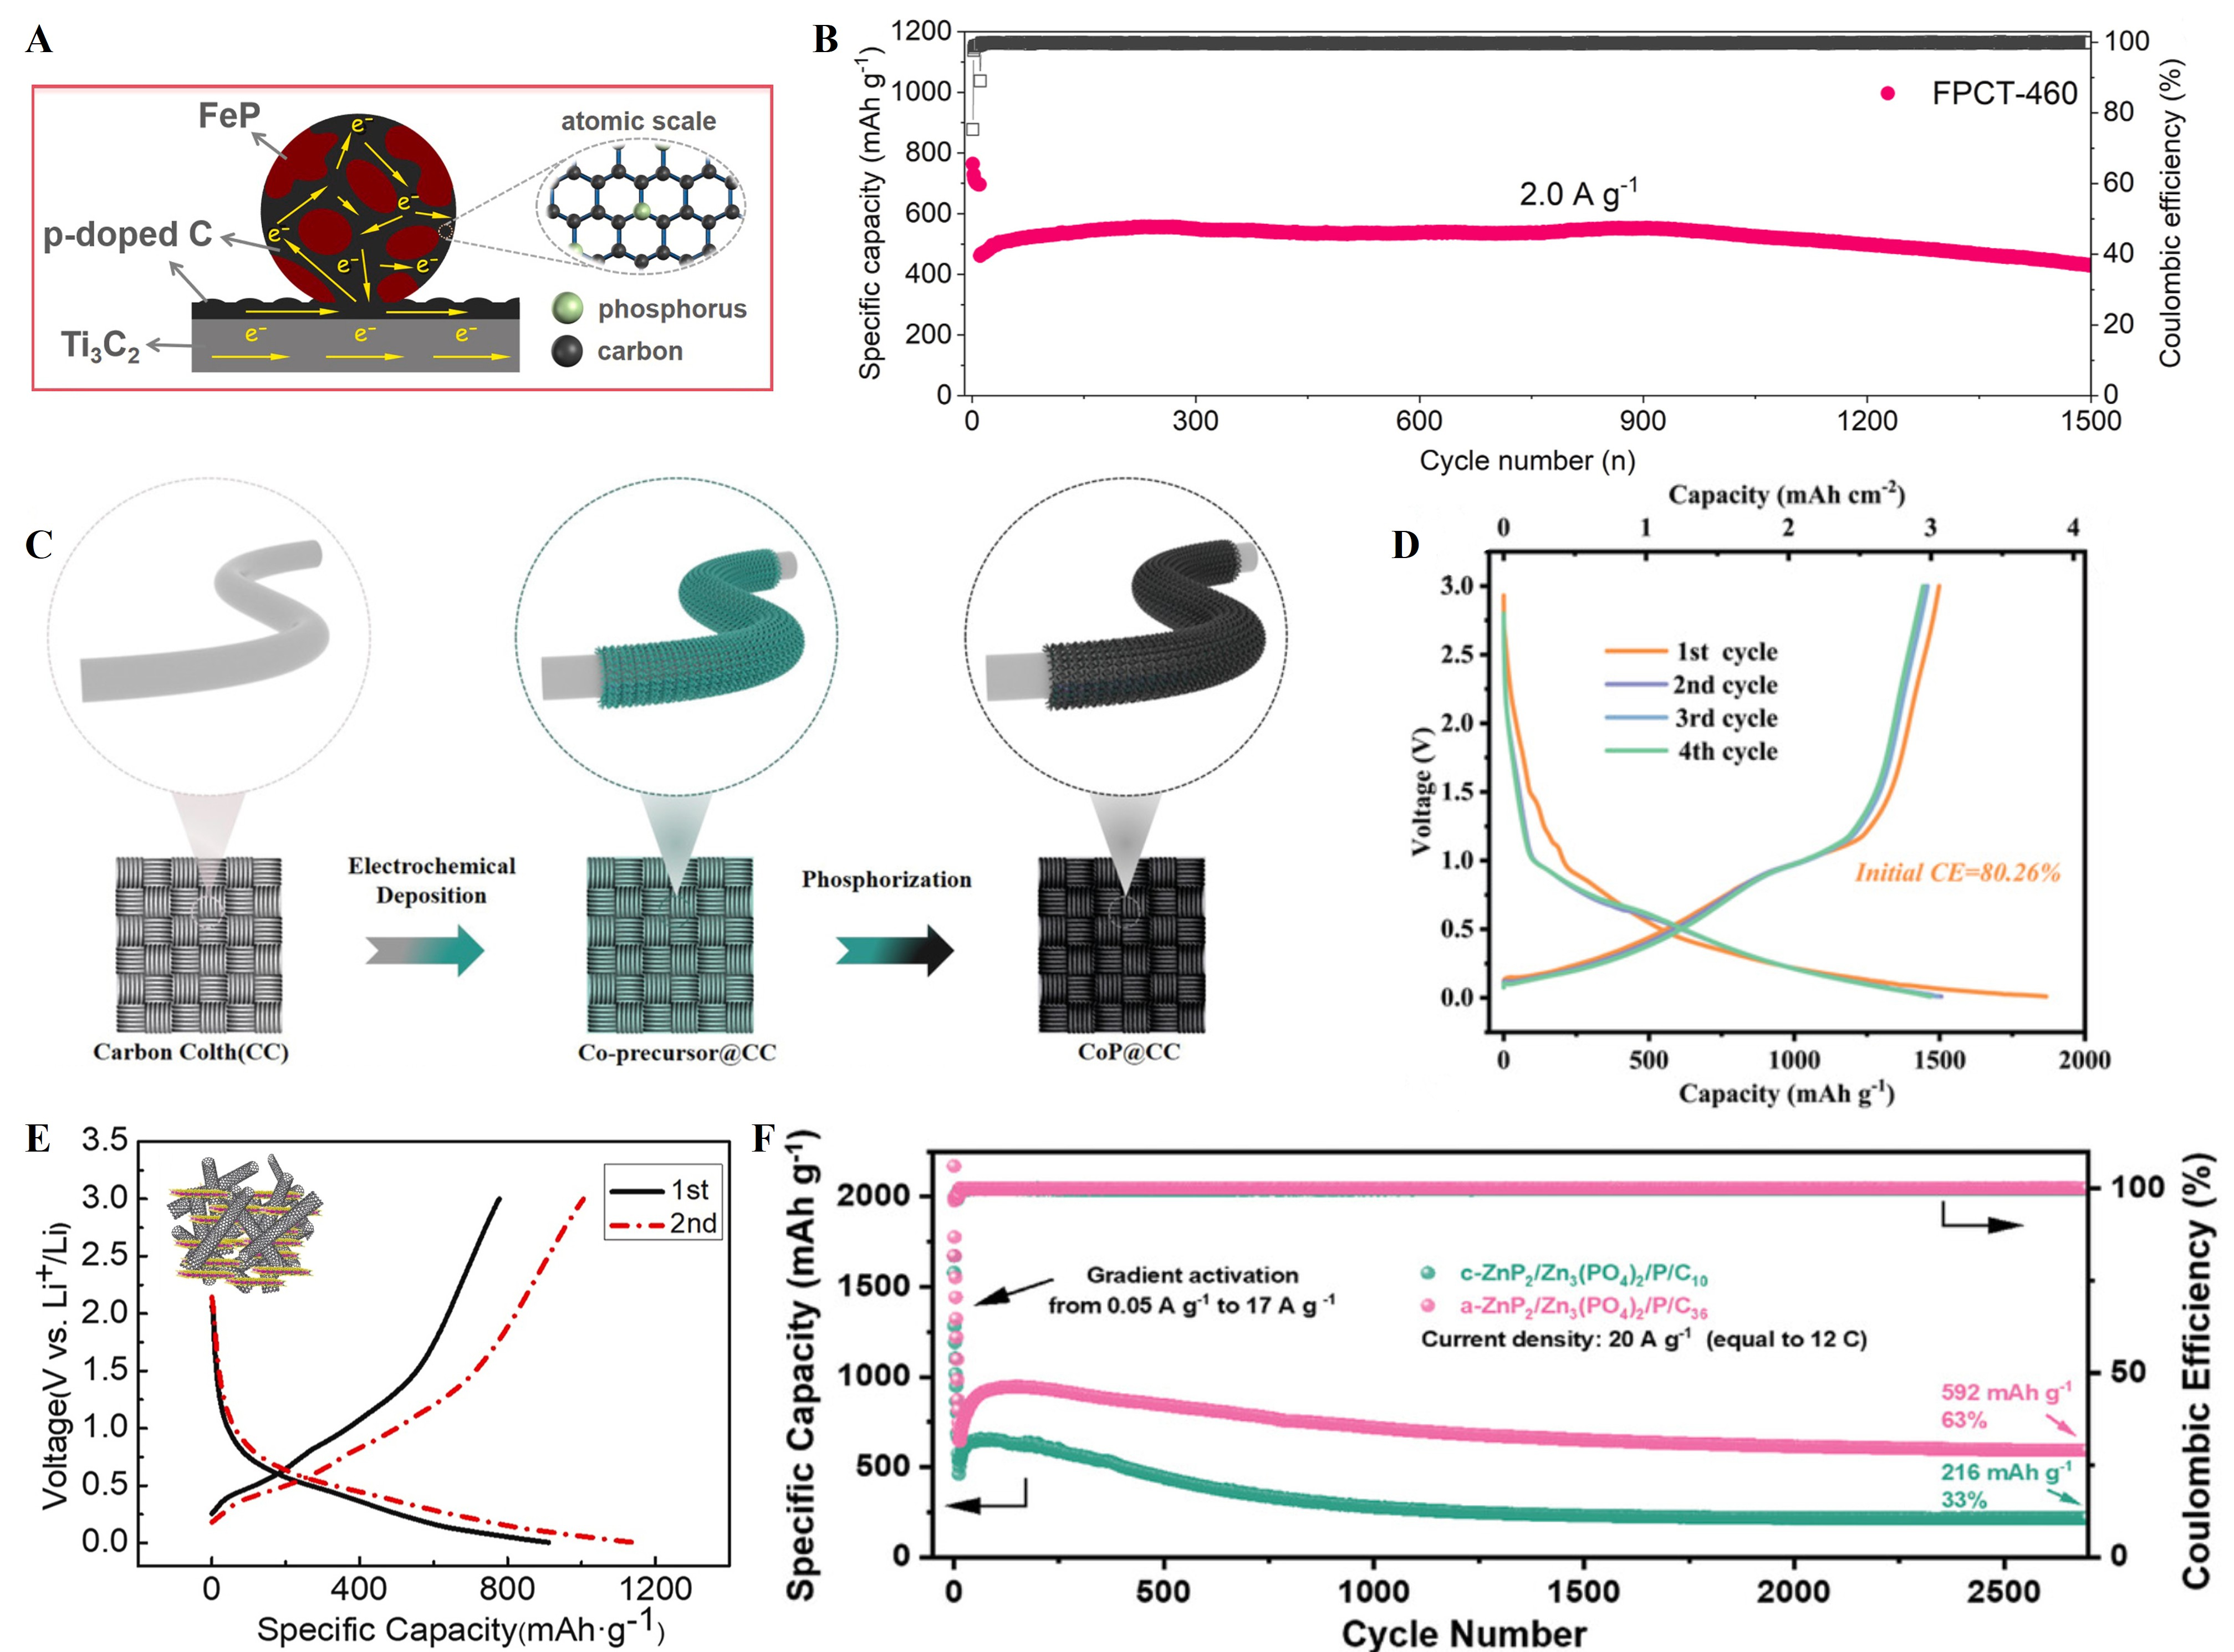
Figure 4. (A) Schematic illustration of the microstructure of FeP@C/Ti3C2 nanocomposite; (B) The cycling performance of the FeP@C/Ti3C2 electrode at a current density of 2 A g-1, maintaining a capacity retention of 93.1% over 1,500 cycles. Reproduced with permission[105]. Copyright 2022, Elsevier; (C) Schematic illustration of the fabrication process of CoP@CC; (D) The first-four charge/discharge profiles of the CoP@CC electrode at 0.1 A g-1. Reproduced with permission[107]. Copyright 2025, John Wiley and Sons; (E) The structure and the charge/discharge profiles of the GeP/SWCNTs electrode in the first two cycles at 0.1 A g-1 with


