


fig2
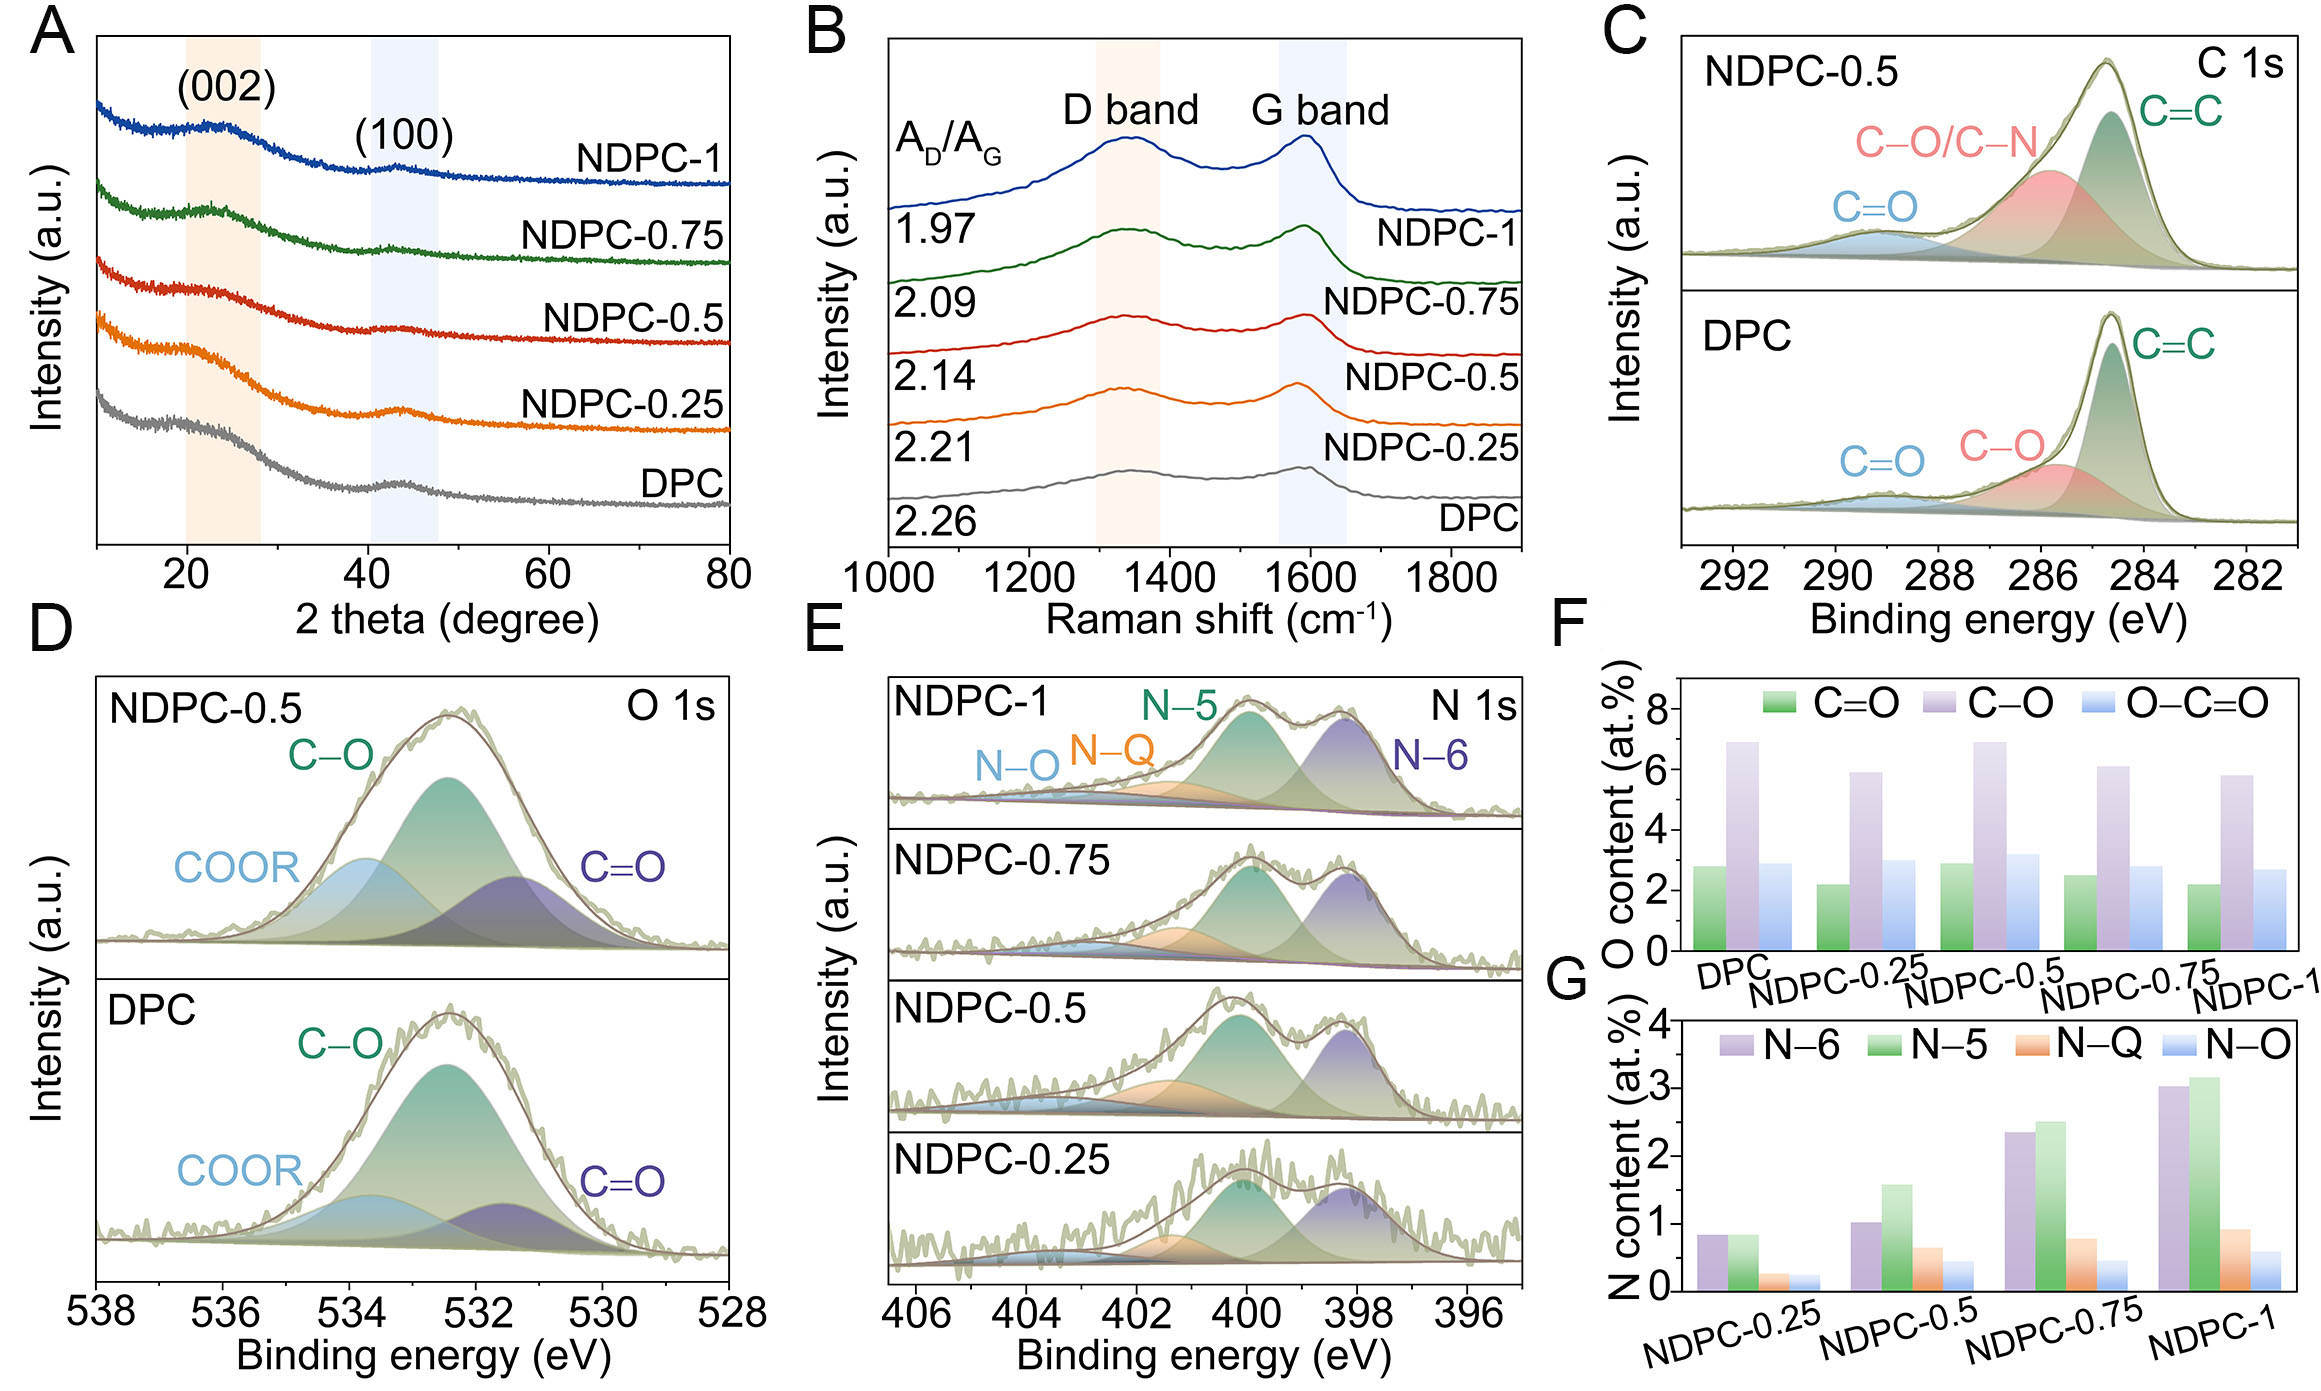
Figure 2. Phase characterization of the materials. (A) XRD patterns, and (B) Raman spectra of NDPCs. (C) XPS C 1s spectra and (D)
Figure 2. Phase characterization of the materials. (A) XRD patterns, and (B) Raman spectra of NDPCs. (C) XPS C 1s spectra and (D)


All published articles are preserved here permanently:
https://www.portico.org/publishers/oae/


