


fig1
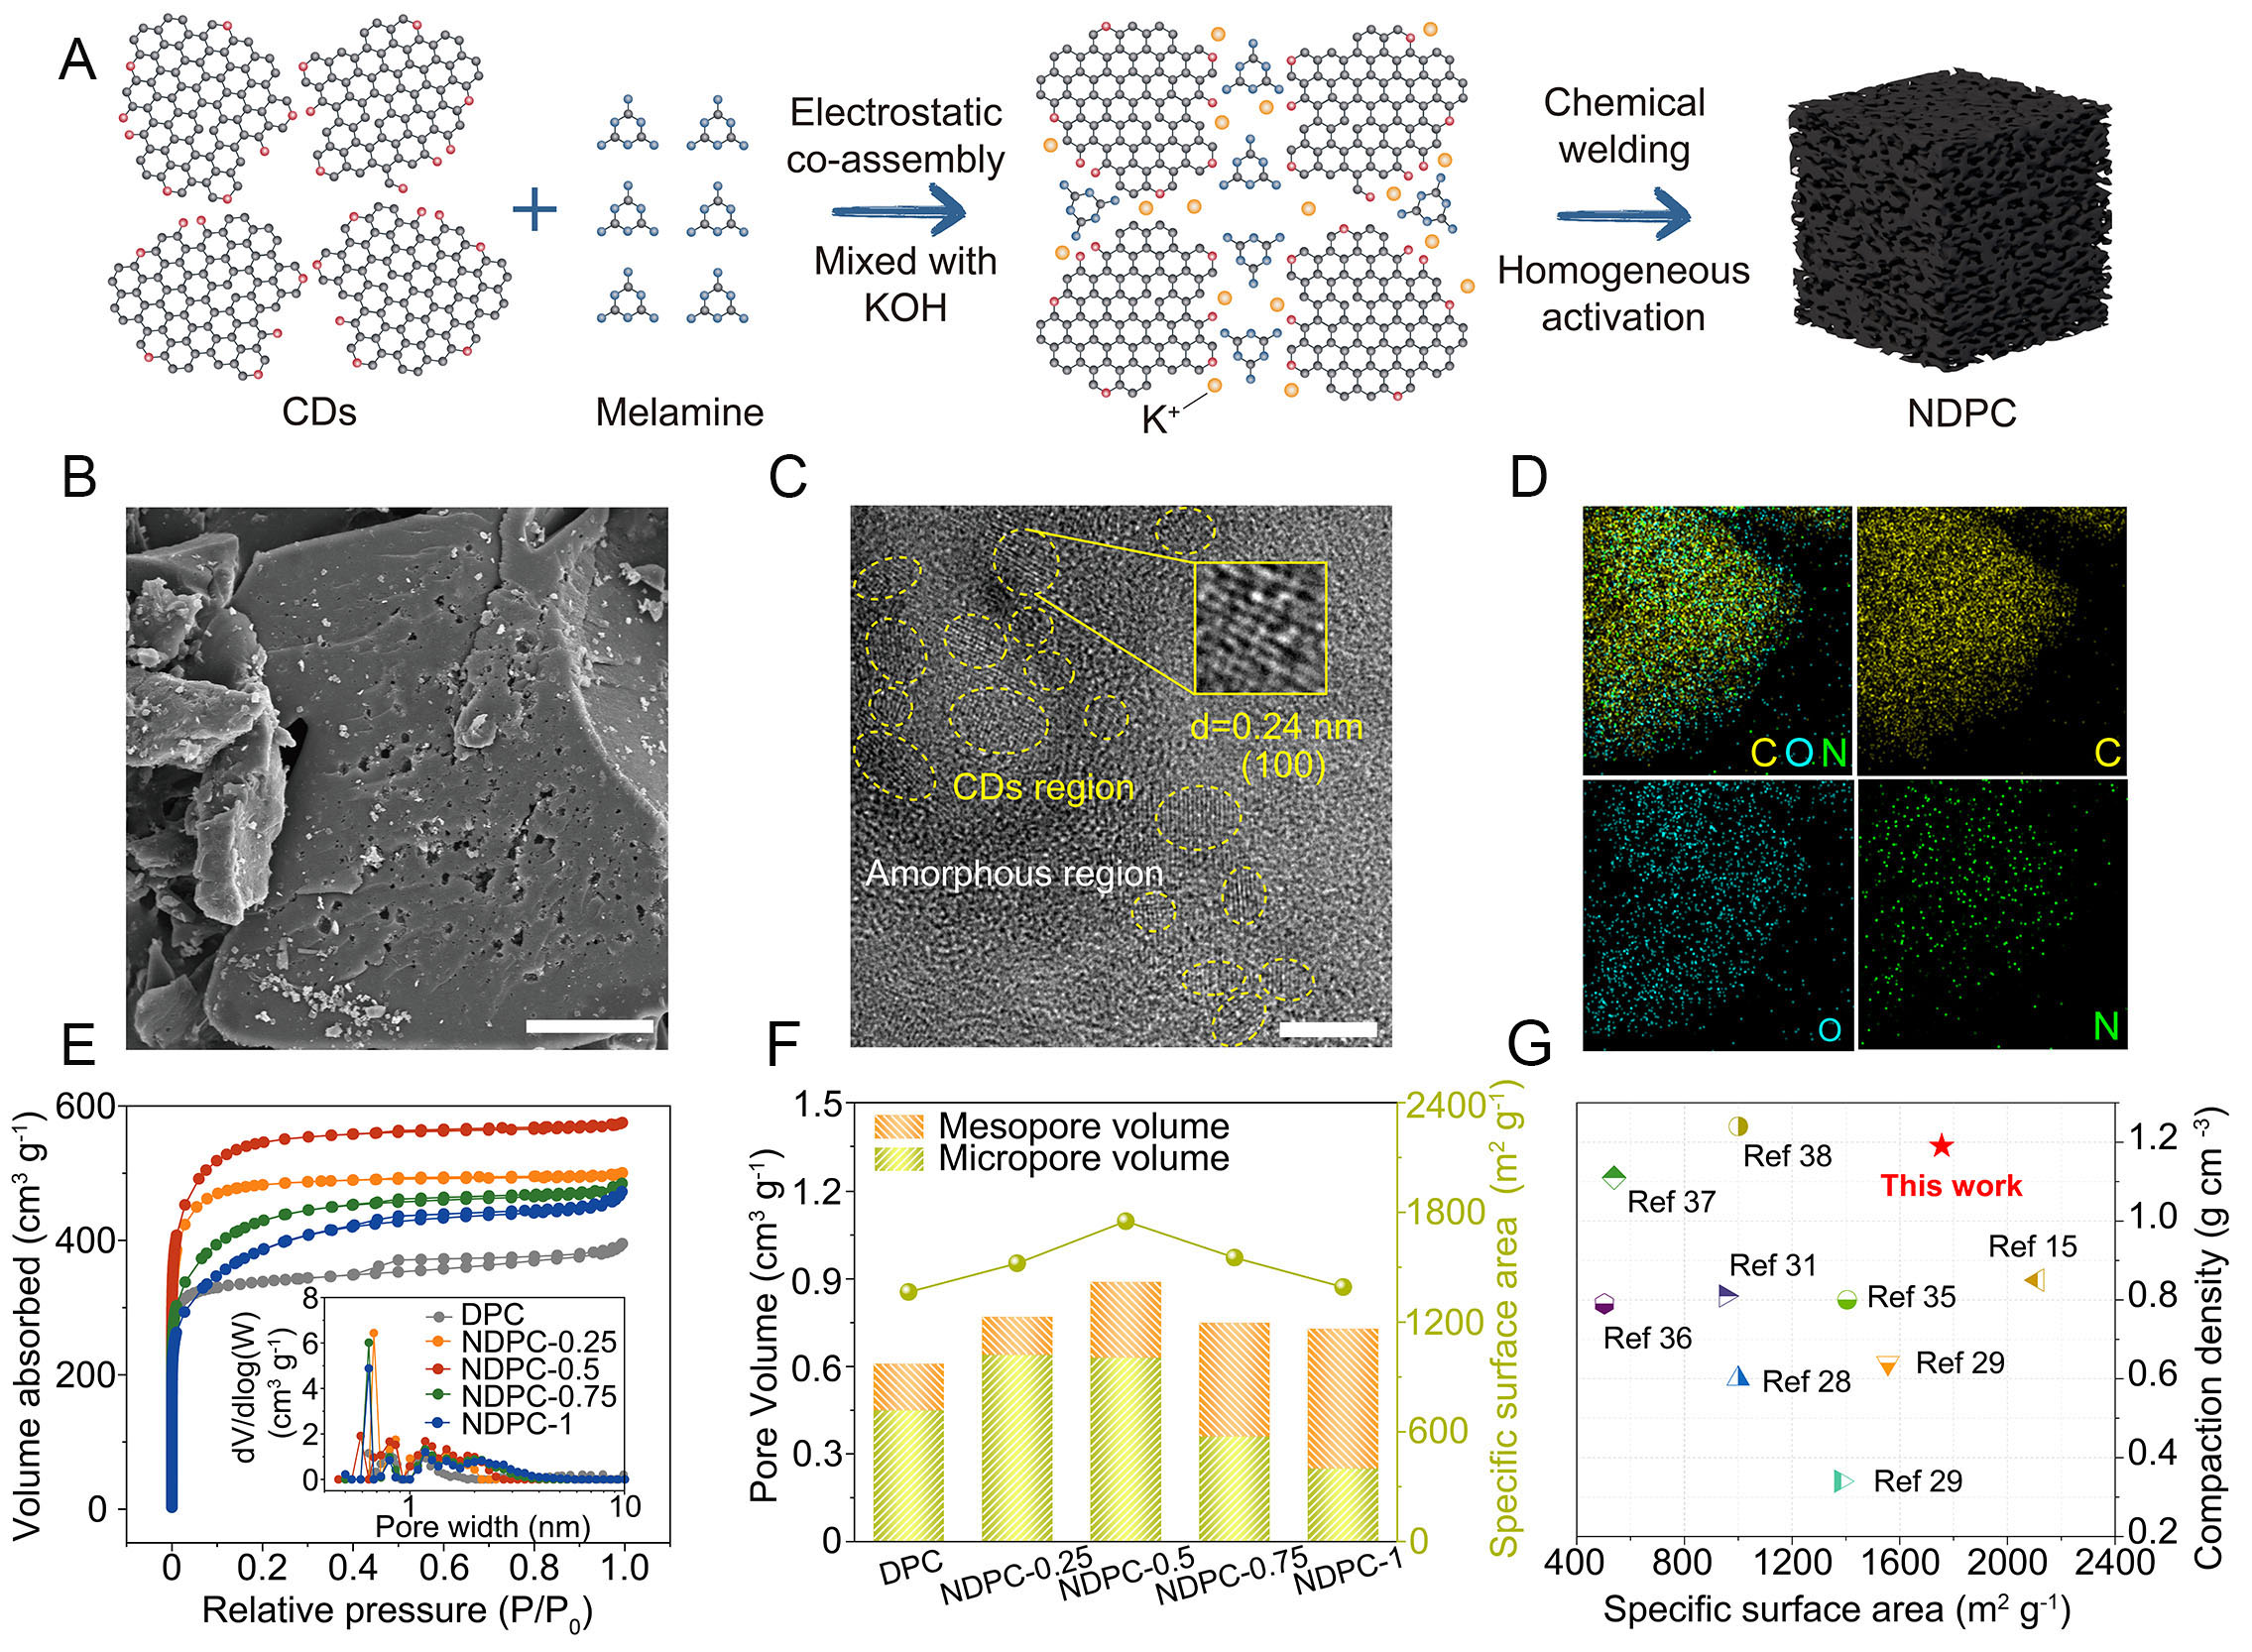
Figure 1. Preparation process, morphology and pore distribution of NDPCs. (A) Illustration of the preparation process and structure of NDPC-0.5. (B) SEM images (scale bar: 10 μm), (C) HRTEM (scale bar: 5 nm) and (D) EDS elemental mapping images of NDPC-0.5. (E) N2 absorption-desorption isotherms and the corresponding pore size distribution plot (inset). (F) Pore volume and SSA of the NDPCs. (G) Comparison of SSA and compaction density of the NDPC-0.5 with other porous carbons.


