
Figure3
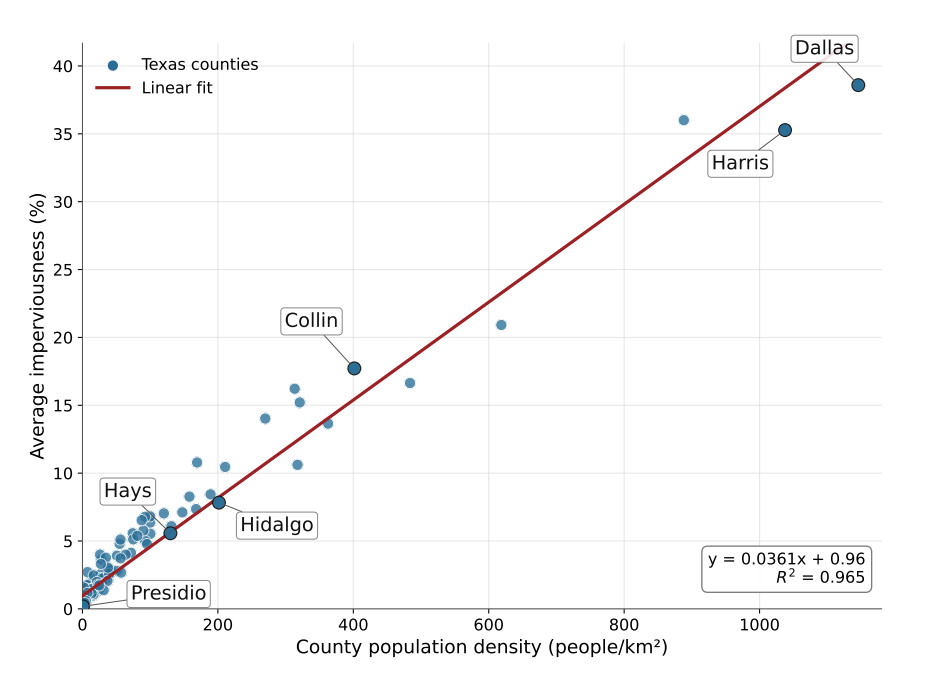
Figure 3. 2021 County Average Imperviousness as a function of population density. Imperviousness increases consistently with population density, furthering the notion that population drives built environment development. As such, imperviousness is used as a proxy for population and urban density in this model. Labeled counties were selected to give a relative understanding for what different levels of population density and imperviousness look like. Dallas and Harris counties represent the urban cores of the Dallas–Fort Worth and Houston metropolitan areas, respectively. Collin, Hidalgo, and Hays counties represent different levels of suburban and exurban land cover, and are located in the DFW, Rio Grande Valley, and San Antonio areas, respectively. Presidio County is located in rural West Texas.