

fig4
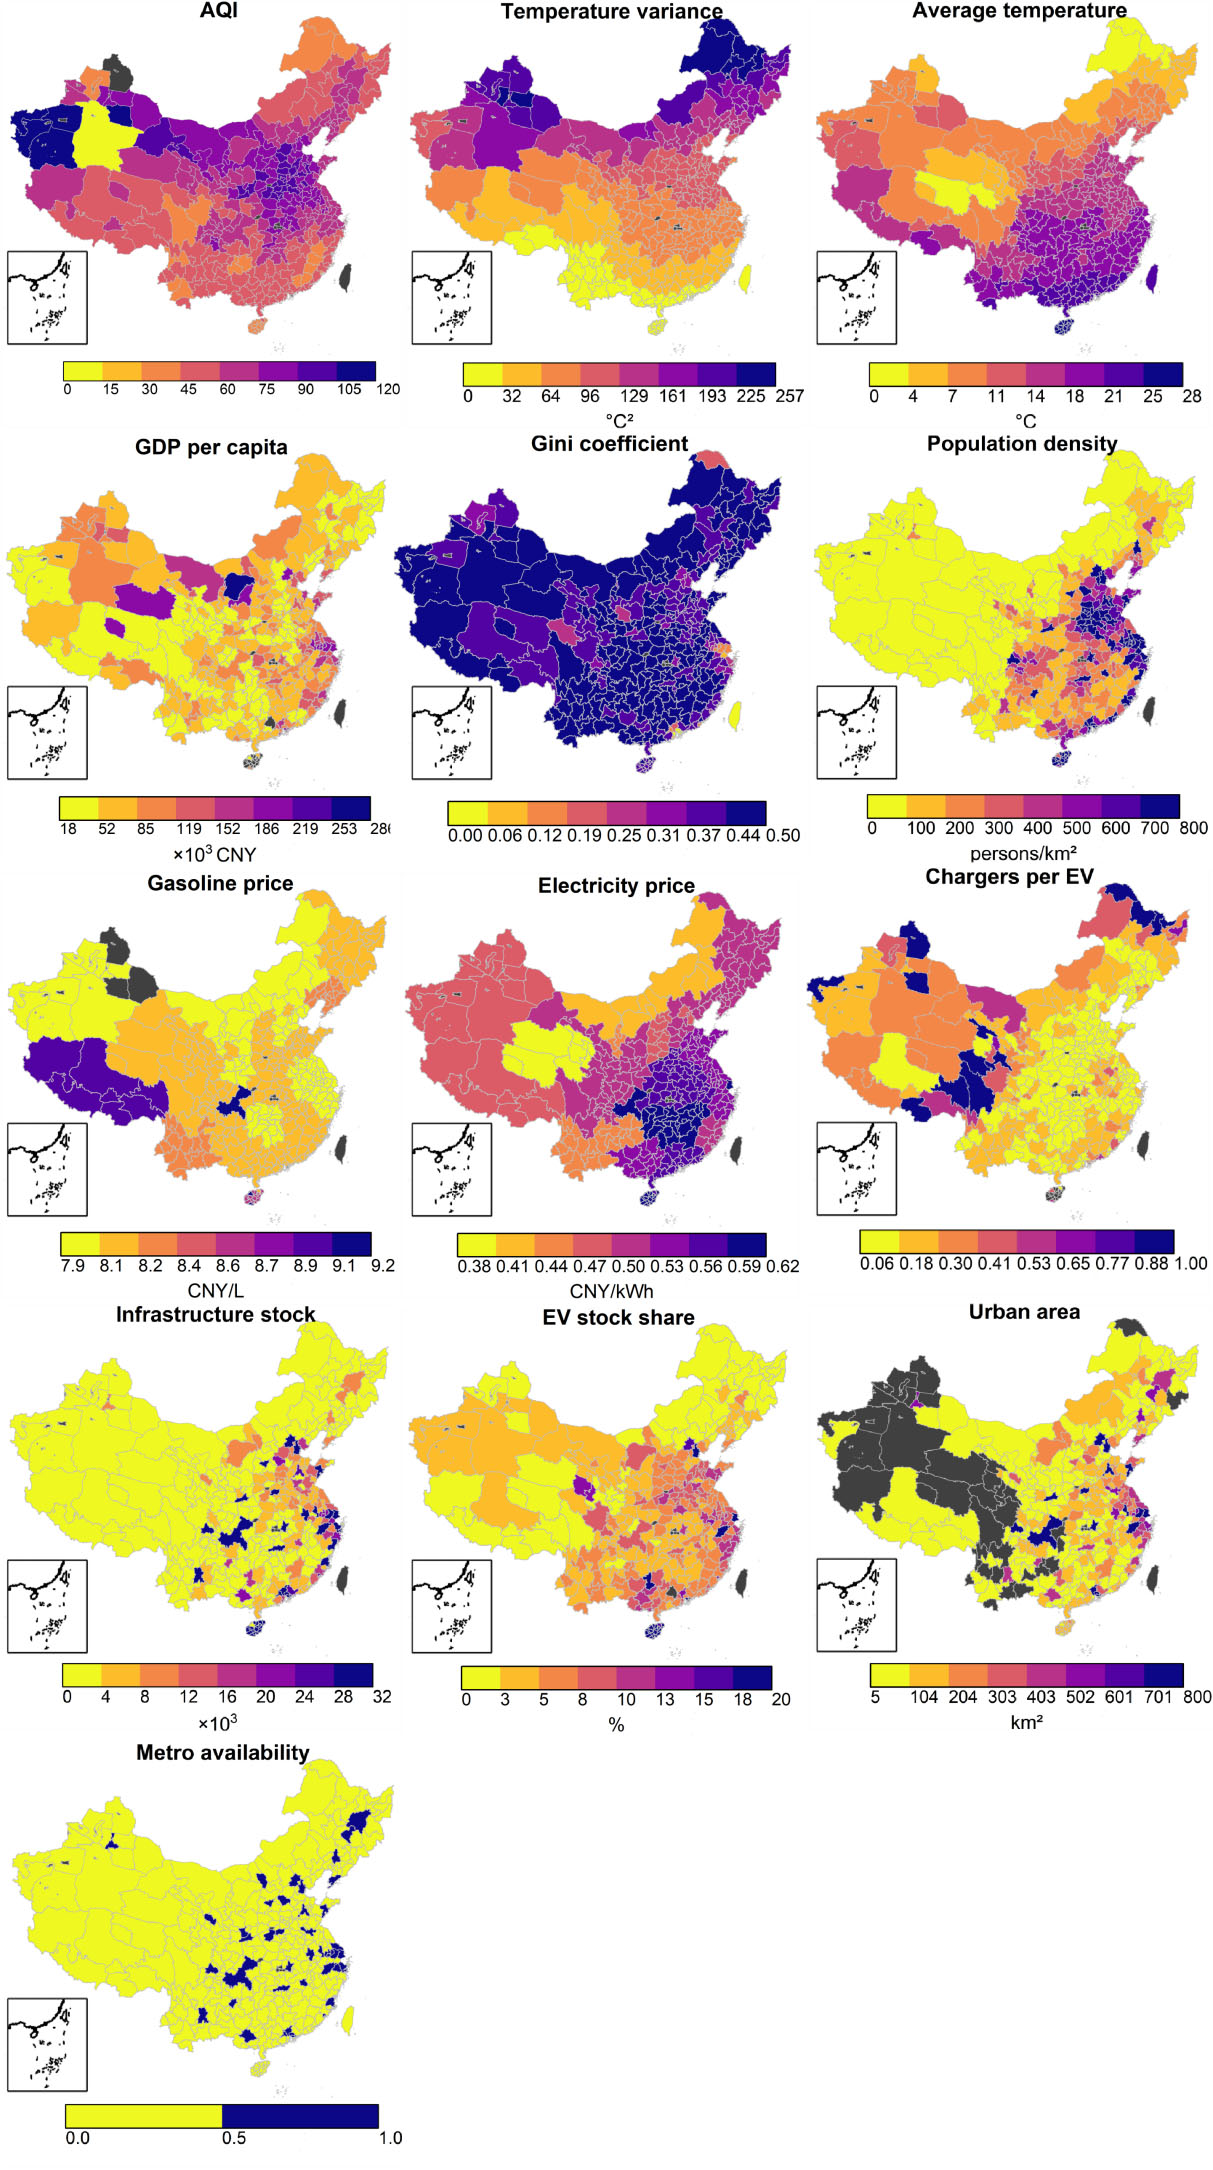
Figure 4. Spatial distribution of the 13 predictors retained in the final model across 296 Chinese prefecture-level cities in 2024. Each panel presents the spatial distribution of one predictor. Color bars indicate the values and units of the corresponding variables. Gasoline and electricity prices are measured at the provincial level and uniformly assigned to cities within each province. Metro availability is a binary variable, where 1 indicates the presence of an operating metro system, and 0 indicates its absence. Grey areas represent cities not included in the final analytical sample. The base map was derived from the standard map of China approved under map approval number GS(2019)1822 and obtained from the Standard Map Service System of the Ministry of Natural Resources of the People’s Republic of China(http://bzdt.ch.mnr.gov.cn/download.html?searchText=GS(2019)1822). The base map boundaries were not modified. AQI: Air quality index.





