



Understanding the influencing factors of electric vehicle penetration in China: a city-level analysis
 0
0 Abstract
Rapid electric vehicle (EV) adoption is central to decarbonizing road transport, but national averages obscure substantial city-level differences, limiting understanding of the local conditions that shape market diffusion and its carbon implications. We assembled a city-year dataset covering 296 Chinese cities from 2019 to 2024 and compiled 21 candidate predictors spanning climatic, environmental, socioeconomic, urban, energy-price, infrastructure, and market-maturity dimensions. Following variable screening, 13 substantive predictors were analyzed using a random forest model with city-grouped validation. SHapley Additive exPlanations (SHAP), a 300-replicate city-block bootstrap, region-specific models, and two alternative model specifications were used to interpret predictions and assess uncertainty and sensitivity. EV penetration increased from 4.0% in 2019 to 44.9% in 2024, while substantial spatial disparities persisted. The model generalized well to held-out cities, achieving an R2 of 0.902, an RMSE of 0.048, and an MAE of 0.027. EV stock share was the most important substantive predictor, followed by gasoline price and charging infrastructure stock. In the dynamic specification, the one-year-lagged penetration rate became the dominant predictor, indicating that EV stock share primarily captures adoption momentum and path dependence rather than an independently identifiable peer effect. Predictor rankings also varied across regions, particularly for gasoline prices and charging infrastructure. These findings describe predictive associations rather than causal effects, but they highlight the importance of considering local market maturity, energy prices, and infrastructure conditions when investigating region-specific electrification strategies. The carbon implications of these strategies should also be assessed in relation to regional grid carbon intensity and powertrain composition.
Keywords
INTRODUCTION
The transportation sector accounts for approximately 25% of global energy-related CO2 emissions, with road transport being the dominant contributor[1]. In response, electric vehicles (EVs), including battery electric vehicles (BEVs) and plug-in hybrid electric vehicles (PHEVs), have emerged as a promising alternative to gasoline and diesel vehicles for mitigating air pollution and reducing greenhouse gas (GHG) emissions[2]. In 2024, global EV sales surpassed 17 million units, and the EV penetration rate, defined as the share of EVs in new passenger vehicle sales, increased from 18% in 2023 to 20%[3]. Despite this rapid growth, the transition remains highly uneven across countries, with some markets experiencing stagnation or even decline[4,5]. For example, Germany’s EV penetration rate fell from 30% in 2022 to 20% in 2024[3]. Understanding why electrification progresses rapidly in some markets while slowing in others is therefore essential for accelerating the decarbonization of road transport[6,7].
China provides an ideal setting for investigating this question because of its market scale and substantial regional diversity. In 2024, China accounted for over 60% of global EV sales, with a total of 11 million units sold[3], and its EV penetration rate increased dramatically from 0.4% in 2014 to 44.9% in 2024[8]. At the same time, Chinese prefecture-level cities differ markedly in climate, economic development, urban form, energy prices, charging infrastructure, and EV adoption, providing a unique opportunity to identify the local factors associated with EV penetration. Recent studies further show that the climate benefits of vehicle electrification vary substantially across regions because they depend on local electricity generation mixes and the pace of renewable energy deployment 9. Moreover, understanding the spatial variation in EV adoption and the factors associated with it at a fine geographic scale is essential for evaluating both market diffusion and the carbon mitigation potential of electrification, while informing region-specific strategies in China and other emerging markets.
Early studies on EV penetration were constrained by limited data availability and largely relied on stated-preference (SP) surveys to assess adoption potential and characterize consumer preferences[10-12]. However, existing research has identified the presence of an “attitude-action gap” in EV markets - consumers’ expressed environmental concerns do not always translate into actual purchase behaviors[13]. Social desirability bias may lead respondents to overstate their willingness to adopt environmentally friendly technologies, thereby compromising the reliability of SP-based results. In light of these limitations, recent studies have increasingly emphasized the use of actual market data to improve the accuracy and external validity of empirical findings[14]. Representative works include using monthly city- or country-level panel data to evaluate the effectiveness of political (e.g., subsidies), technical (e.g., charging infrastructure), socioeconomic (e.g., income), and natural factors (e.g., temperature) on EV market share based on multivariate regression models[15-17].
Although these studies have significantly advanced our understanding of EV adoption, many rely on outdated or low-resolution datasets, which limit their ability to capture spatial heterogeneity at finer geographic scales. In addition, traditional statistical methods such as linear regression or fixed-effects models are limited in their ability to capture complex nonlinear relationships and high-order interactions among variables[18]. To address these challenges, recent research has increasingly turned to machine learning (ML) approaches, which offer more flexible and powerful tools for modeling nonlinear dynamics and identifying key predictors from large, high-dimensional datasets[18,19], making them well-suited for analyzing multifactorial influences on EV adoption[20]. For example, a recent study combined ensemble machine learning models with SHapley Additive exPlanations (SHAP) to identify the key factors of EV adoption at a fine geographic scale[21]. However, comparable city-level evidence for China remains limited, particularly regarding nonlinear associations and regional heterogeneity in the factors influencing EV adoption.
This study aims to conduct a comprehensive analysis of the key influencing factors of EV penetration across China, leveraging an interpretable ML framework and a city-level dataset. By incorporating high-resolution, geo-referenced data, we seek to provide a more nuanced understanding of regional disparities in EV adoption. To capture spatial heterogeneity, we categorized the cities into four major geographic regions and validated the statistical significance of these divisions using analysis of variance (ANOVA), thereby confirming the appropriateness of the regional segmentation. Based on this classification, we further investigated the region-specific factors influencing EV penetration. Specifically, we employed a random forest (RF) model to identify influencing factors of EV penetration and capture their nonlinear relationships. SHAP was used to interpret model predictions, while bootstrap confidence intervals quantified the stability of variable importance rankings. Together, these methods provide a robust and interpretable framework for understanding EV adoption dynamics. This study seeks to address the following research questions: (1) What are the spatial and temporal patterns of EV penetration across Chinese cities? (2) Which factors are most strongly associated with EV adoption at the national level in China? (3) How do the impacts of these factors vary across different geographic regions, and what policy insights can be drawn to promote balanced EV development nationwide? By integrating high-resolution data with interpretable machine learning, this study provides robust evidence to support region-specific EV policies and accelerate transport decarbonization.
METHOD AND DATA
Data and study scope
The initial vehicle-sales database covered 337 prefecture-level cities in mainland China from 2019 to 2024. After integrating the vehicle data with the explanatory variables and completing the data-cleaning procedures, 41 cities with missing data that could not be reliably imputed were excluded. Due to data limitations, Hong Kong, Macau, and Taiwan are excluded from the analysis.
The vehicle dataset includes sales and stock information for four major powertrain types: BEVs, PHEVs, internal combustion engine vehicles (ICEVs), and fuel cell vehicles (FCVs). Throughout this study, EVs refer specifically to plug-in electric vehicles, comprising BEVs and PHEVs. FCVs were treated as a separate powertrain category and were not counted as EVs because their market share was negligible during the study period. The EV penetration rate for city i in year t was calculated as:
where BEVs and PHEVs are combined into a single indicator of EV adoption. Detailed information for the vehicle dataset can be found in the Supplementary Materials.
We used a variety of publicly available data sources to obtain city-level explanatory variables, aiming to explore potential associations between these factors and EV penetration rates. Based on a comprehensive review of the existing literature[13,22-26], we compiled a candidate pool of 21 variables previously identified as potentially relevant to EV adoption [Figure 1]. These variables were incorporated into the dataset and grouped into seven thematic categories: climate condition (average temperature, temperature variation), air quality [air quality index (AQI), particulate matter (PM)2.5, PM10, SO2, NO2, CO, O3], socioeconomic factors (GDP per capita, Gini coefficient, population density), urban characteristic (urban area, road length, metro availability), energy prices (gasoline price, electricity price), infrastructure factor (infrastructure stock, public chargers per EV), market maturity (EV stock, EV stock share). Detailed definitions, spatial resolutions, and data sources of each variable are provided in Table 1 and Supplementary Materials. The statistical descriptions of each variable are shown in Supplementary Table 1.
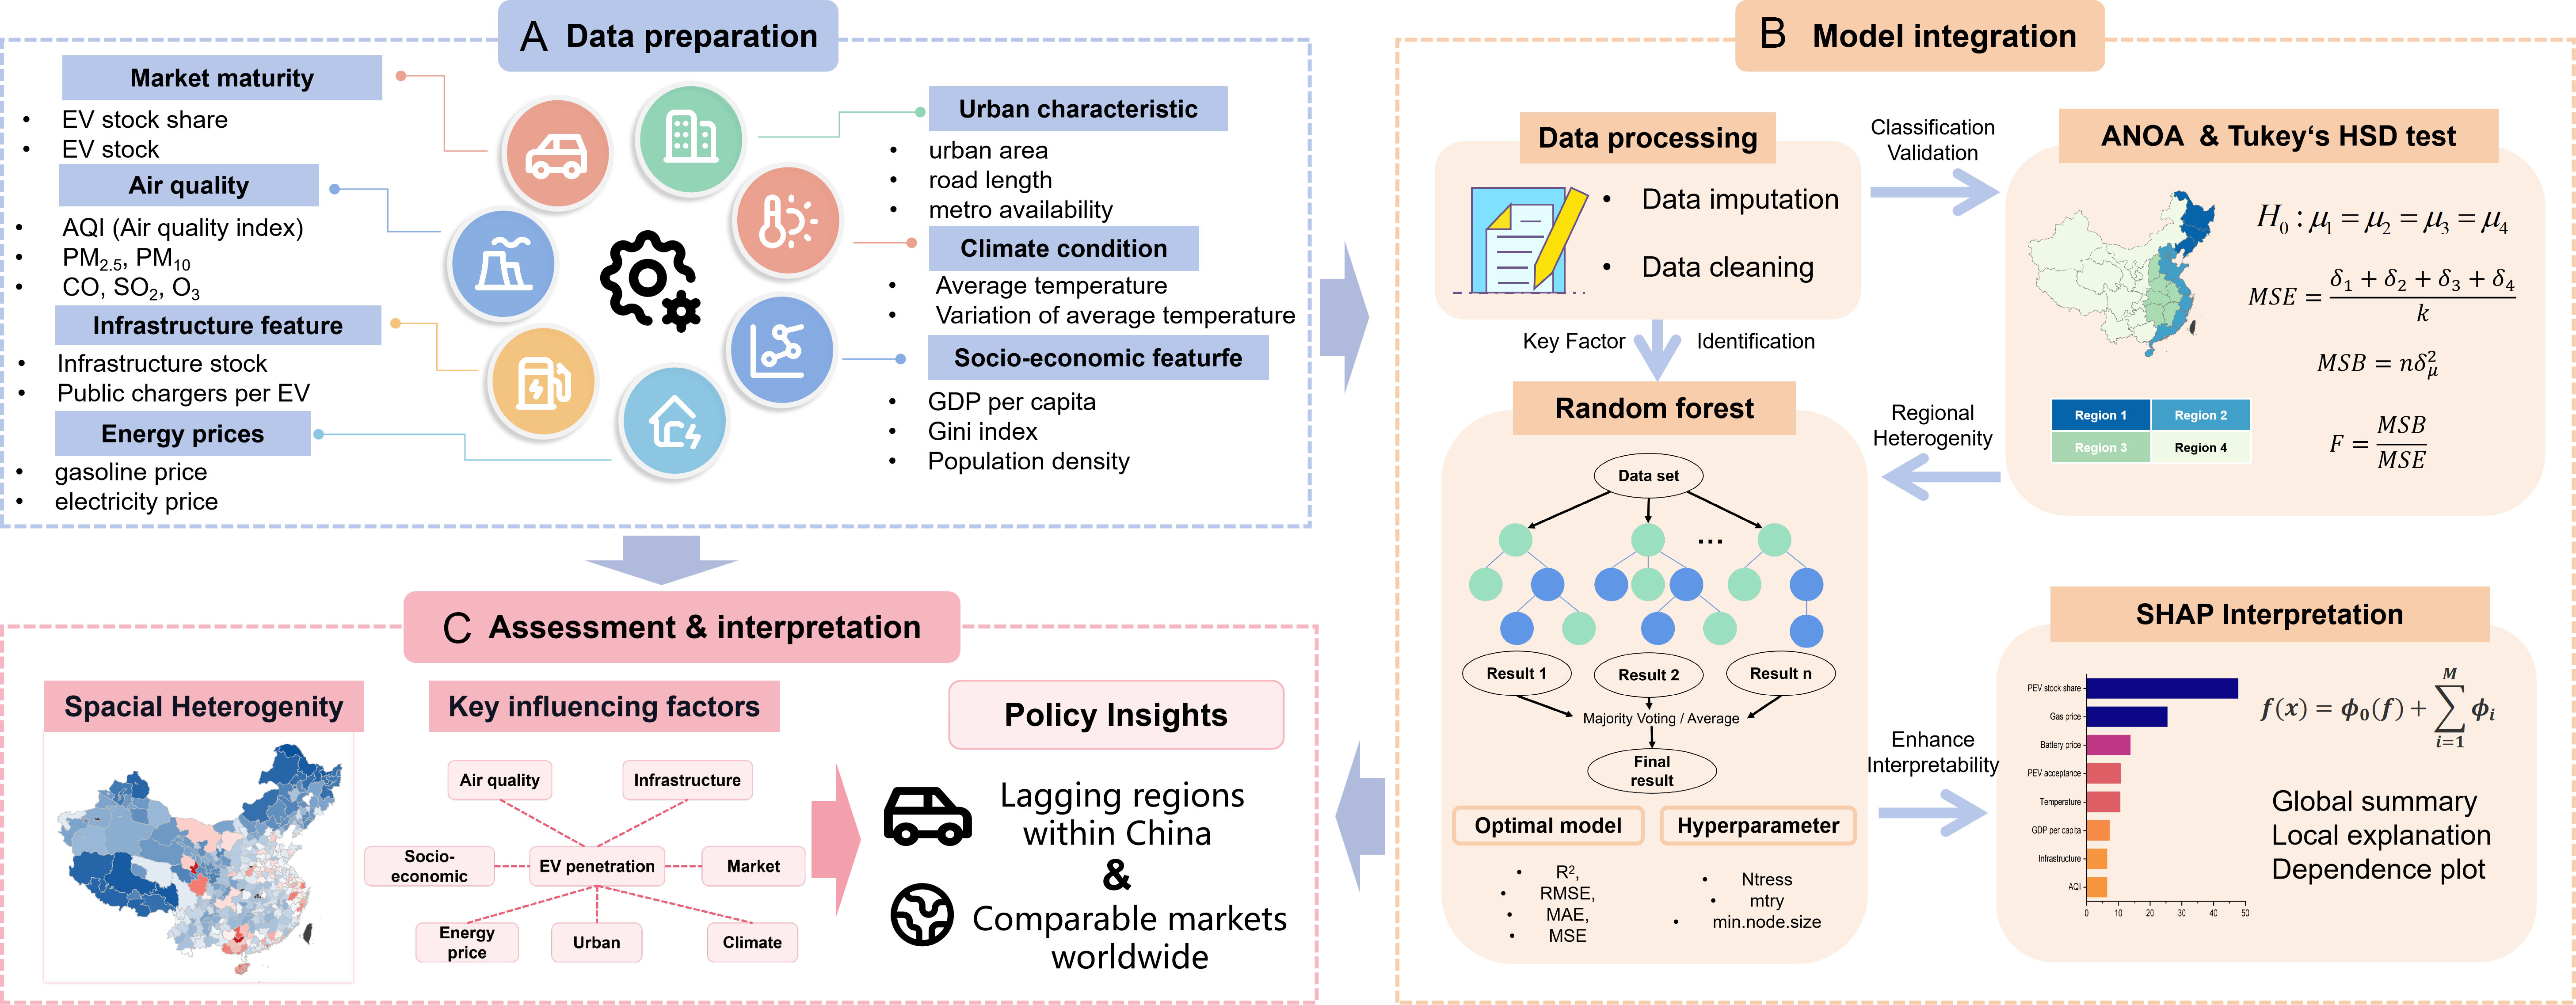
Figure 1. Overall workflow of the study; (A) Data preparation, in which a comprehensive dataset covering market maturity, public infrastructure, air quality, climate, energy prices, socioeconomic conditions, and urban characteristics was assembled; (B) Model integration, which includes data processing (imputation and cleaning), regional validation using ANOVA and Tukey’s HSD test, machine learning modeling, and SHAP interpretation; (C) Assessment and interpretation, where spatial heterogeneity is visualized, key driving factors are synthesized, and policy implications are derived to support region-specific EV promotion strategies. The base map was derived from the standard map of China approved under map approval number GS(2019)1822 and obtained from the Standard Map Service System of the Ministry of Natural Resources of the People’s Republic of China (http://bzdt.ch.mnr.gov.cn/download.html?searchText=GS(2019)1822). The base map boundaries were not modified. RMSE: Root mean squared error; MAE: mean absolute error; MSE: mean squared error; EV: electric vehicle; HSD: honestly significant difference; ANOVA: analysis of variance; SHAP: SHapley Additive exPlanations.
Variables integrated in the dataset
| Variable name | Definition | Resolution |
| EV penetration rate | - | City level |
| EV stock | EV ownership | City level |
| EV stock share | Ratio of EV ownership to total vehicle ownership | City level |
| Average temperature | Annual average temperature | City level |
| Temperature variance | Variance of monthly average temperatures | City level |
| AQI | Annual mean of the monthly city-level air quality index values | City level |
| PM2.5 | Annual mean of the monthly city-level PM2.5 concentrations | City level |
| PM10 | Annual mean of the monthly city-level PM10 concentrations | City level |
| NO2 | Annual mean of the monthly city-level NO2 concentrations | City level |
| CO | Annual mean of the monthly city-level CO concentrations | City level |
| SO2 | Annual mean of the monthly city-level SO2 concentrations | City level |
| O3 | Annual mean of the monthly city-level O3 concentrations | City level |
| Gasoline price | Arithmetic average of monthly prices | Provincial level |
| Electricity price | Government-regulated first-tier residential electricity tariff (RMB/kWh) for standard single-meter households in each province | Provincial level |
| Infrastructure stock | Number of public charging points | City level |
| Public chargers per EV | Ratio of public charging points to EV ownership | City level |
| GDP per capita | - | City level |
| Gini coefficient | Describing development disparities within cities | City level |
| Population density | The number of permanent residents divided by the city’s administrative area | City level |
| Urban area | Built-up area of the city | City level |
| Road length | Length of Roads (km) | City level |
| Metro availability | A dummy variable equal to 1 if the city had an operational metro in that year, and 0 otherwise. | City level |
Data processing
Not all variables were accessible at the city level. Among the explanatory variables used in this study, gasoline price and electricity price are available only at the provincial level and were assumed to be uniform across all cities within a given province; all other retained variables were obtained at the city level.
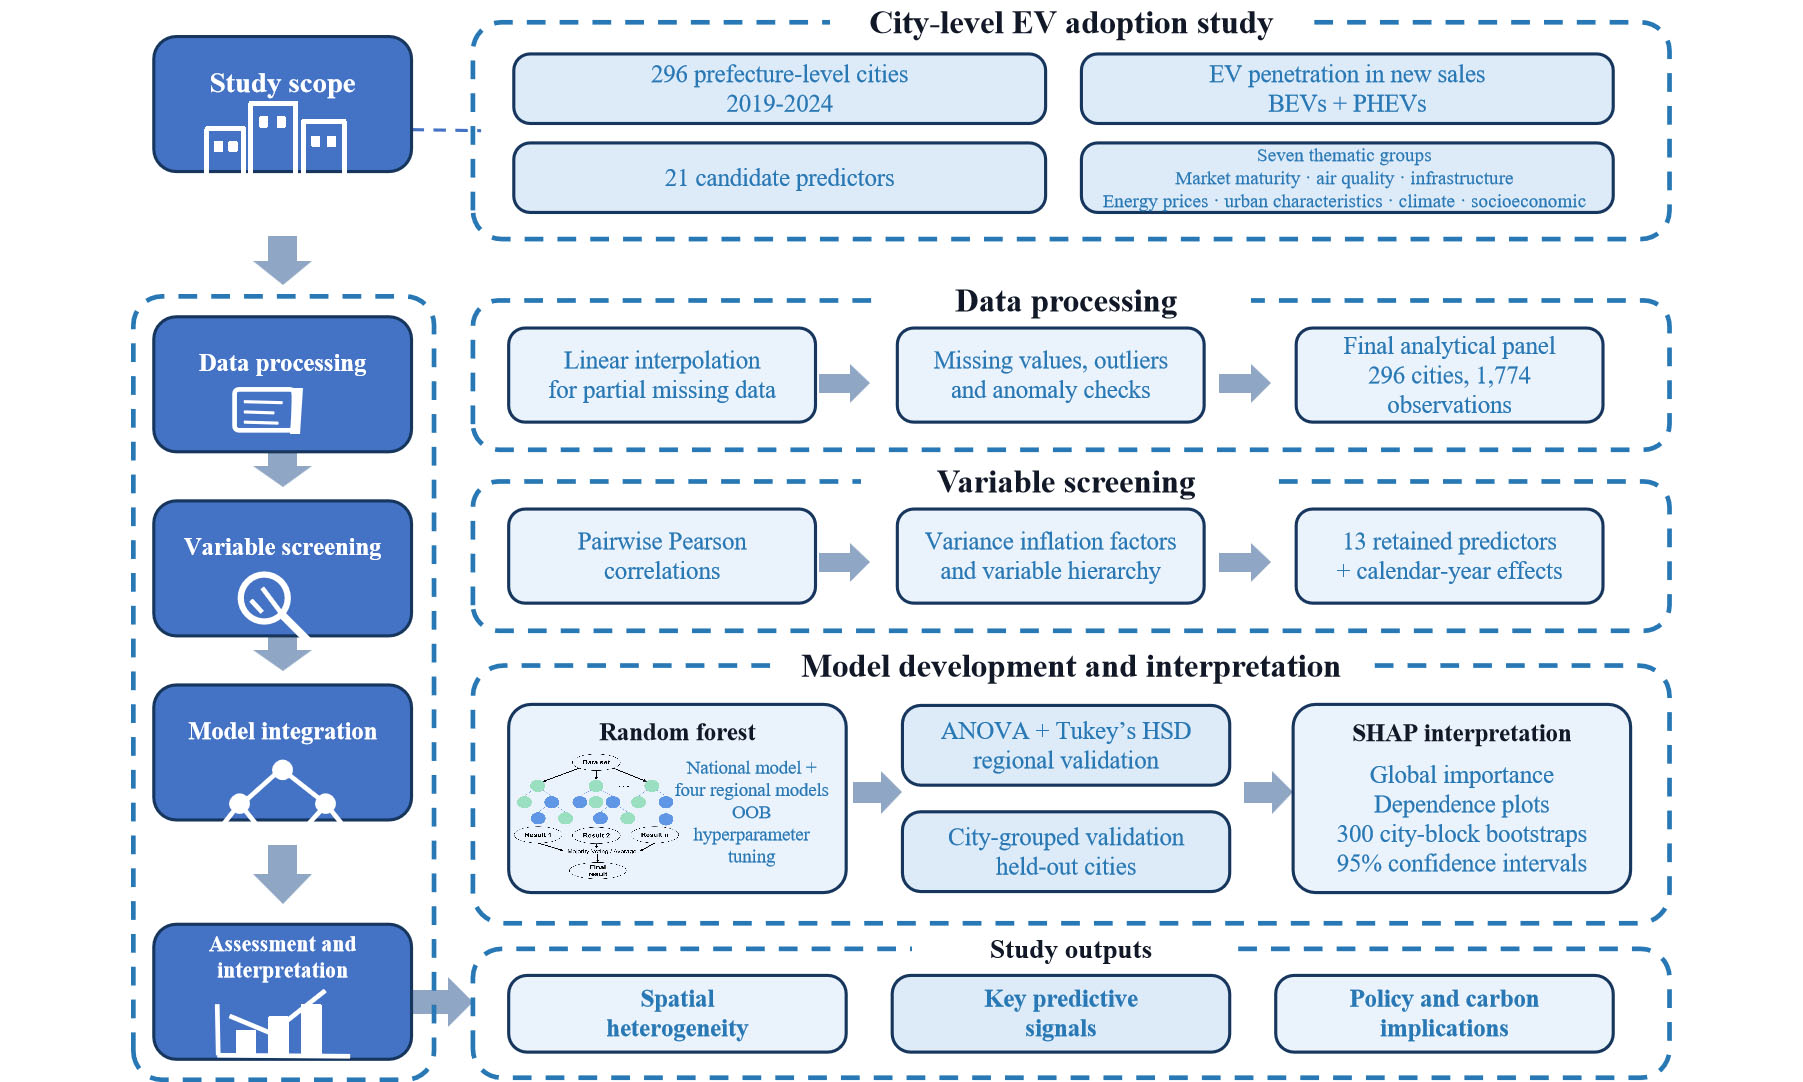
To ensure data quality and consistency, we applied the following preprocessing procedures. First, intermittent missing values in the explanatory variables were imputed using within-city linear interpolation. Second, the dataset was examined for missing values, outliers, and potential data anomalies. Cities with incomplete data that could not be reliably imputed were excluded. Of the 337 cities covered by the initial vehicle-sales database, 41 were excluded during data integration and cleaning, resulting in a final analytical sample of 296 cities for model development and evaluation.
Regional classification and validation
To investigate the spatial heterogeneity of EV penetration and its regional-specific factors, we classified the 296 cities in the final analytical sample into four major geographic regions: Northeast, East, Central, and West. To characterize differences among the four geographic regions, we conducted one-way ANOVA to assess whether the mean values of selected indicators differed across regions.
In addition, post hoc multiple comparisons were conducted using Tukey’s HSD test to identify which pairs of regional means differed significantly. The resulting P-values were adjusted for multiple testing within each group of variables and were used to determine whether the mean values of selected indicators varied significantly across regions.
Random forest modeling and interpretation
To identify the key factors influencing EV penetration, we developed an RF regression model. The RF algorithm constructs an ensemble of decision trees, each trained on a randomly selected subset of the data and a random subset of predictor variables. The final prediction is obtained by aggregating the outputs of all individual trees. RF models are known for their high predictive accuracy and robustness to overfitting. In addition to its predictive capabilities, RF can identify influential predictors using permutation-based variable importance. Specifically, each explanatory variable is randomly permuted, and the resulting increase in the model’s mean squared error (MSE) is calculated. A larger increase in MSE indicates that the variable contributes more strongly to predictive performance. However, while correlated predictors do not compromise predictive accuracy, they can render permutation-based importance measures unstable or biased.
Before model fitting, we implemented a variable-screening stage combining Pearson correlation coefficients among all predictor variables [Supplementary Figure 1], variance inflation factors (VIF, Supplementary Table 2), and variable-hierarchy considerations. Predictor pairs with |r| > 0.8 were assessed individually, and the more theoretically relevant and interpretable variable was retained where substantial overlap existed. Accordingly, the composite AQI was retained in place of the six individual pollutant measures, urban area was retained in place of road length (r = 0.94), and EV stock was excluded in favor of EV stock share. Although average temperature and temperature variation were strongly negatively correlated (r = -0.82), both were retained because they capture distinct climatic dimensions: average temperature reflects the overall thermal environment, whereas temperature variation represents seasonal fluctuations. This screening procedure reduced the initial set of 21 candidate variables to 13 substantive predictors. The pairwise correlations among the final predictors are presented in Figure 2, and their VIF values are reported in Supplementary Table 3. In addition to these substantive predictors, calendar year was included as a categorical variable in all model specifications.
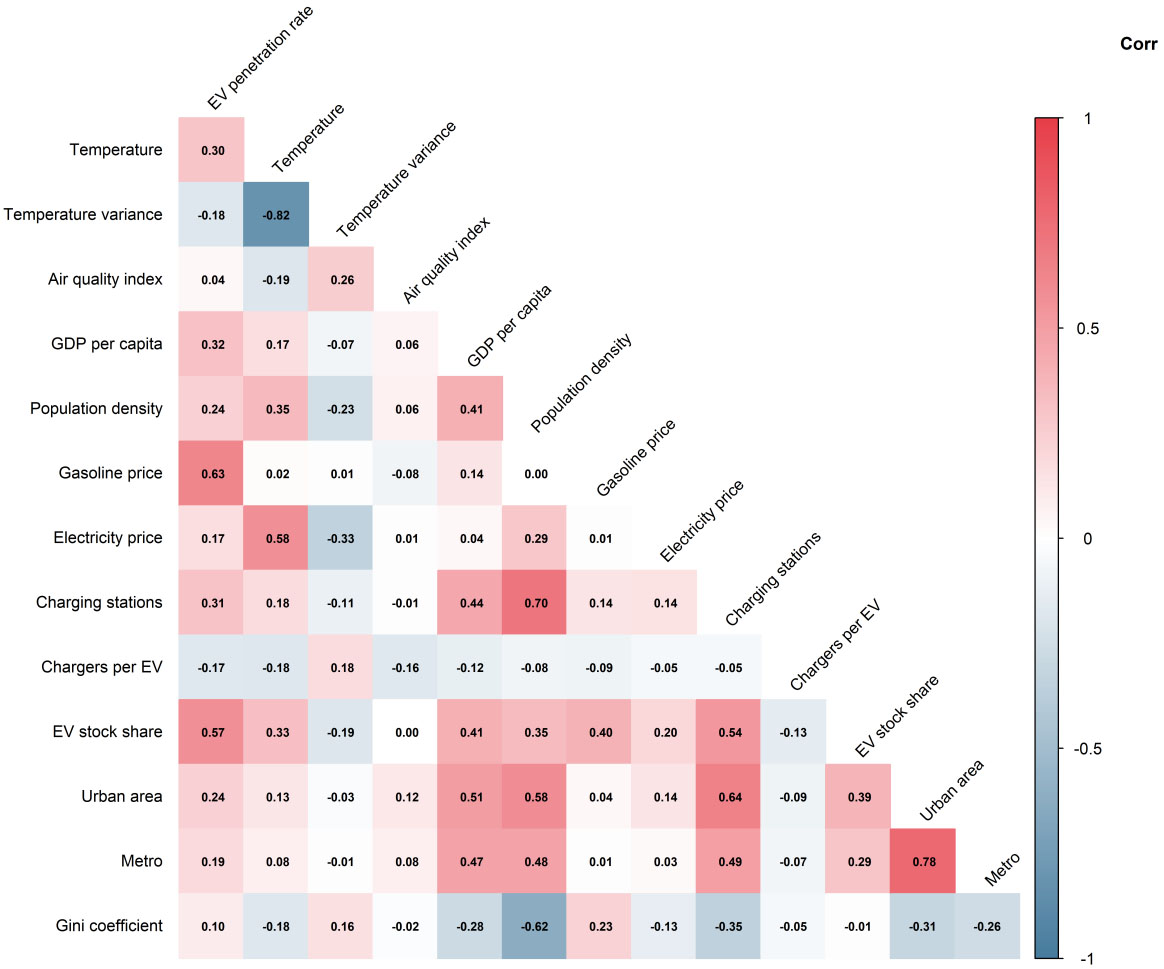
Figure 2. Pearson correlation of 13 predictors retained for final model development. Only the lower triangle of the matrix is shown; the value and color of each cell denote the same correlation coefficient, ranging from +1 (perfect positive linear correlation) through 0 (no linear correlation) to -1 (perfect negative linear correlation). EV: Electric vehicle.
We applied the RF model to 296 cities in China for regression analysis. Model validation employed a city-grouped design. Data were split by city, with 80% of cities forming the training set and the remaining 20% held out entirely, so that test performance measures generalization to cities never seen during training rather than interpolation within known ones. Hyperparameters were selected by grid search on out-of-bag (OOB) error within the training cities, and the final model was fitted with 1,000 trees. A random observation-level split was additionally evaluated as a robustness check [Supplementary Table 4].
We therefore employed SHAP to complement permutation importance and provide a more robust interpretation of the model. SHAP values decompose each prediction into additive contributions of the predictors, and their mean absolute values provide a global importance measure. SHAP values quantify contributions to model predictions rather than causal effects. Relationships between individual predictors and the outcome are visualized with SHAP dependence plots, which are evaluated only at observed data points and therefore avoid the unrealistic predictor combinations that partial dependence plots can entail under correlated predictors. To quantify the sampling uncertainty of importance estimates, we implemented a city-block bootstrap: cities were resampled with replacement (300 replicates), retaining all years of each sampled city so that within-city temporal correlation was preserved. For each replicate, the model was refitted and mean absolute SHAP importance recomputed, yielding 95% percentile confidence intervals and rank-stability statistics. Finally, we verified the agreement between SHAP-based and permutation-based rankings (Section Uncertainty in variable importance), indicating that our conclusions are not artifacts of a particular importance metric.
To assess the sensitivity of our findings to model specification, we conducted two additional analyses: (1) re-estimating the model after excluding EV stock share and (2) estimating a dynamic specification in which the one-year-lagged EV penetration rate replaced EV stock share. The design and results of these analyses are reported in Sections Uncertainty in variable importance and EV stock share: adoption momentum as the dominant signal and in the Supplementary Materials.
Using a similar modeling framework, we also built separate RF models for each of the four geographic regions (Northeast, East, Central, and West) to assess the spatial heterogeneity of factors influencing EV penetration. Each regional model used the same predictor set and year controls as the national model, with hyperparameters tuned separately per region. Given the smaller regional samples, regional performance was evaluated using OOB metrics. All statistical analyses were conducted in R version 4.5.3. One-way ANOVA and Tukey’s HSD tests were performed using the base R stats package, while the RF models and SHAP analyses were implemented using the randomForest and fastshap packages, respectively.
RESULTS
EV market penetration in China
EV penetration data across Chinese cities from 2019 to 2024 are first compiled and examined. Despite the negative impact of the COVID-19 pandemic on the passenger vehicle market in 2020, China’s EV sector exhibited remarkable growth. During the study period, EV penetration in China increased significantly from 4.0% in 2019 to 44.9% in 2024, representing an average annual growth rate of 62.2%. This rapid expansion underscores China’s leading position in the global EV market and reflects the accelerating pace of its transition toward low-carbon transportation.
Behind this national-level expansion, however, lies significant spatial heterogeneity in the electrification of annual passenger vehicle sales, as illustrated in Figure 3. For instance, in 2024, Laibin recorded the highest EV penetration rate among all cities at 77.7%, while Nagqu reported the lowest rate at just 1.5%. Historically, the early stages of EV market development in China were concentrated in a small number of economically advanced cities, with adoption gradually diffusing from the southeastern coastal regions to central and western parts of the country. Among cities with annual EV sales of at least 1,000 units, the ten cities with the highest EV penetration rates in 2019 were Liuzhou (Guangxi, 24.7%), Shenzhen (Guangdong, 18.4%), Beijing (14.7%), Sanya (Hainan, 14.1%), Wuhu (Anhui, 12.9%), Guangzhou (Guangdong, 12.7%), Tianjin (11.9%), Hangzhou (Zhejiang, 10.2%), Weifang (Shandong, 9.4%) and Haikou (Hainan, 9.3%). Most of these cities are located in eastern China, the country’s most economically developed region. Notably, Liuzhou, a small and less developed city in western China, achieved the highest EV penetration rate in 2019, reaching 24.7% with over 80,000 registered EVs, surpassing many larger and more economically advanced cities.
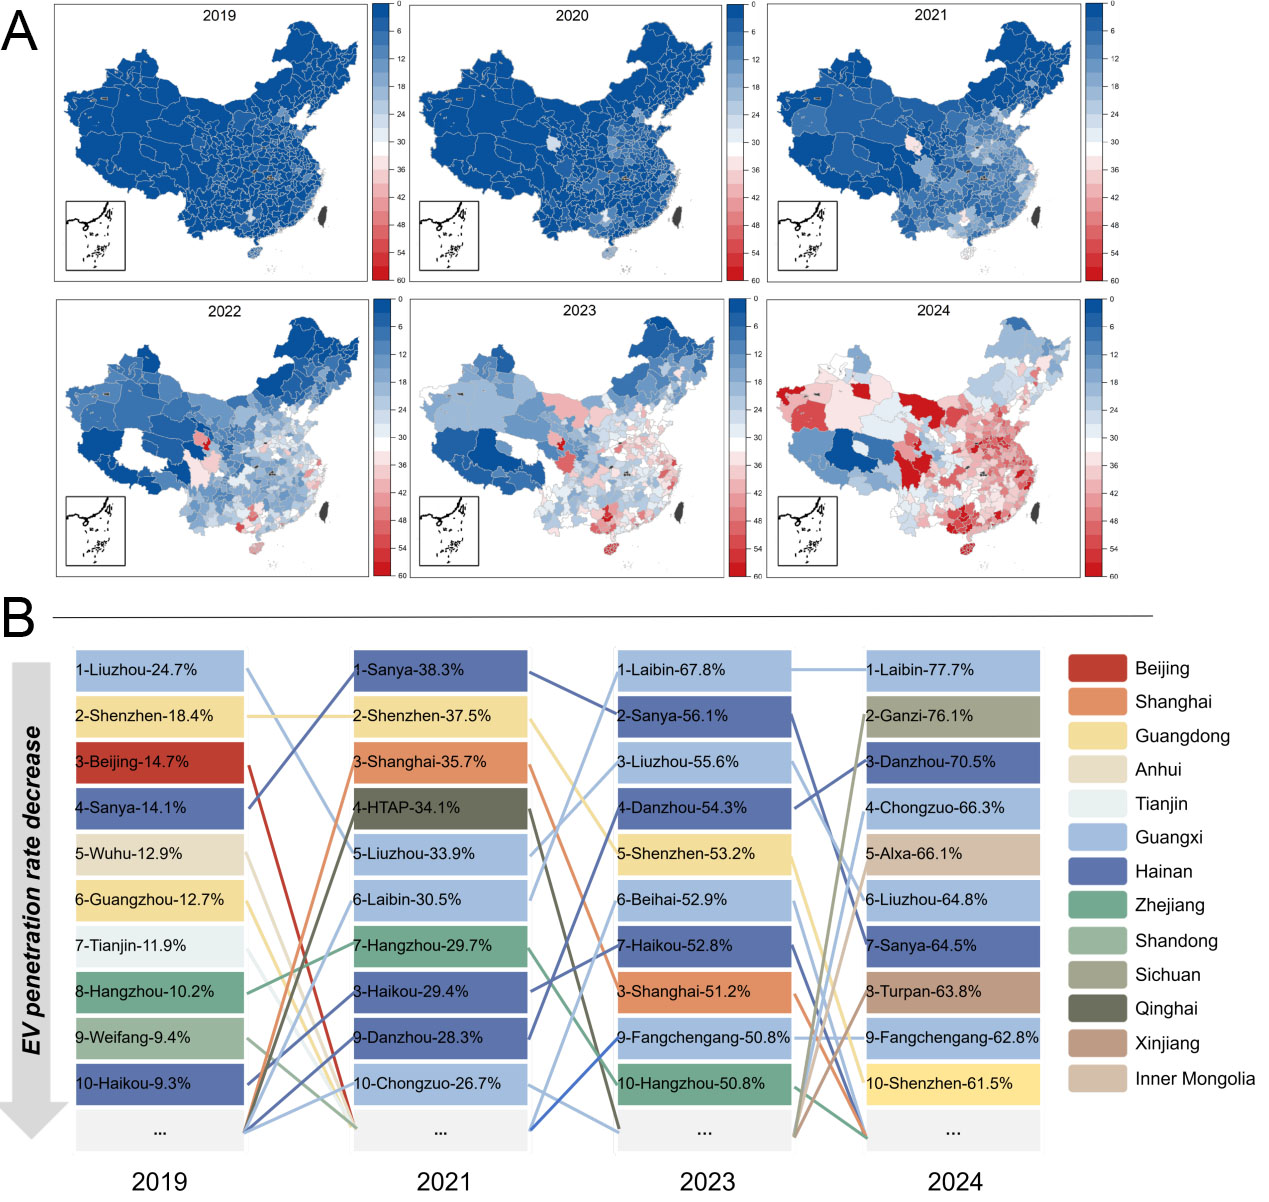
Figure 3. Temporal and spatial evolution of EV penetration across Chinese cities from 2019 to 2024. (A) Spatial distribution of city-level EV penetration. Color values are capped at 60% for visual clarity; cities exceeding this threshold (up to 77.7%) are displayed in the same maximum color category; (B) Top ten cities ranked by EV penetration rate in selected years (2019, 2021, 2023, and 2024). Cities with fewer than 1,000 annual EV sales were excluded. HTAP refers to Hainan Tibetan Autonomous Prefecture. Ganzi refers to Ganzi Tibetan Autonomous Prefecture. The base map in panel (A) was derived from the standard map of China approved under map approval number GS(2019)1822 and obtained from the Standard Map Service System of the Ministry of Natural Resources of the People’s Republic of China(http://bzdt.ch.mnr.gov.cn/download.html?searchText=GS(2019)1822). The base map boundaries were not modified. EV: Electric vehicle.
Across 2023 and 2024, many lower-tier cities experienced rapid increases in EV penetration, indicating that the market was expanding beyond major urban centers. Among cities with at least 1,000 annual EV sales, the ten cities with the highest EV penetration in 2024 included Laibin (Guangxi, 77.7%), Ganzi (Sichuan, 76.1%), Danzhou (Hainan, 70.5%), Chongzuo (Guangxi, 66.3%), Alxa (Inner Mongolia, 66.1%), Liuzhou (Guangxi, 64.8%), Sanya (Hainan, 64.5%), Turpan (Xinjiang, 63.8%), Fangchenggang (Guangxi, 62.8%), and Shenzhen (Guangdong, 61.5%). Among these cities, several are located in Guangxi and Hainan provinces, which have emerged as national leaders in EV penetration. This success can be attributed to a combination of targeted local incentives, favorable regulatory environments, and mild climate conditions that support year-round EV usage.
Overall, China’s EV market has evolved from early pilot programs in pioneering cities to nationwide expansion. Spatially, EV penetration in eastern coastal cities is significantly higher than in central and western cities, forming multiple geographic clusters and following a clear diffusion pattern from southeast to northwest. This spatial dynamic provides a strong foundation for conducting region-based analyses in the following sections.
Identify the key factors influencing EV penetration in China
In this study, we incorporated a comprehensive set of candidate variables, grounded in prior literature, to capture the key factors affecting EV penetration across 296 prefecture-level cities in China from 2019 to 2024. As visualized in Figure 4, the 13 variables span seven dimensions from climate to market maturity (Section Data and study scope, Table 1). This diverse, city-level dataset enables a fine-grained analysis of spatial heterogeneity in EV adoption, supporting a more nuanced understanding of the interacting factors behind China’s electrification trends. Due to data limitations and the challenges of quantifying policy variables, this study does not explicitly account for the impact of policy factors.
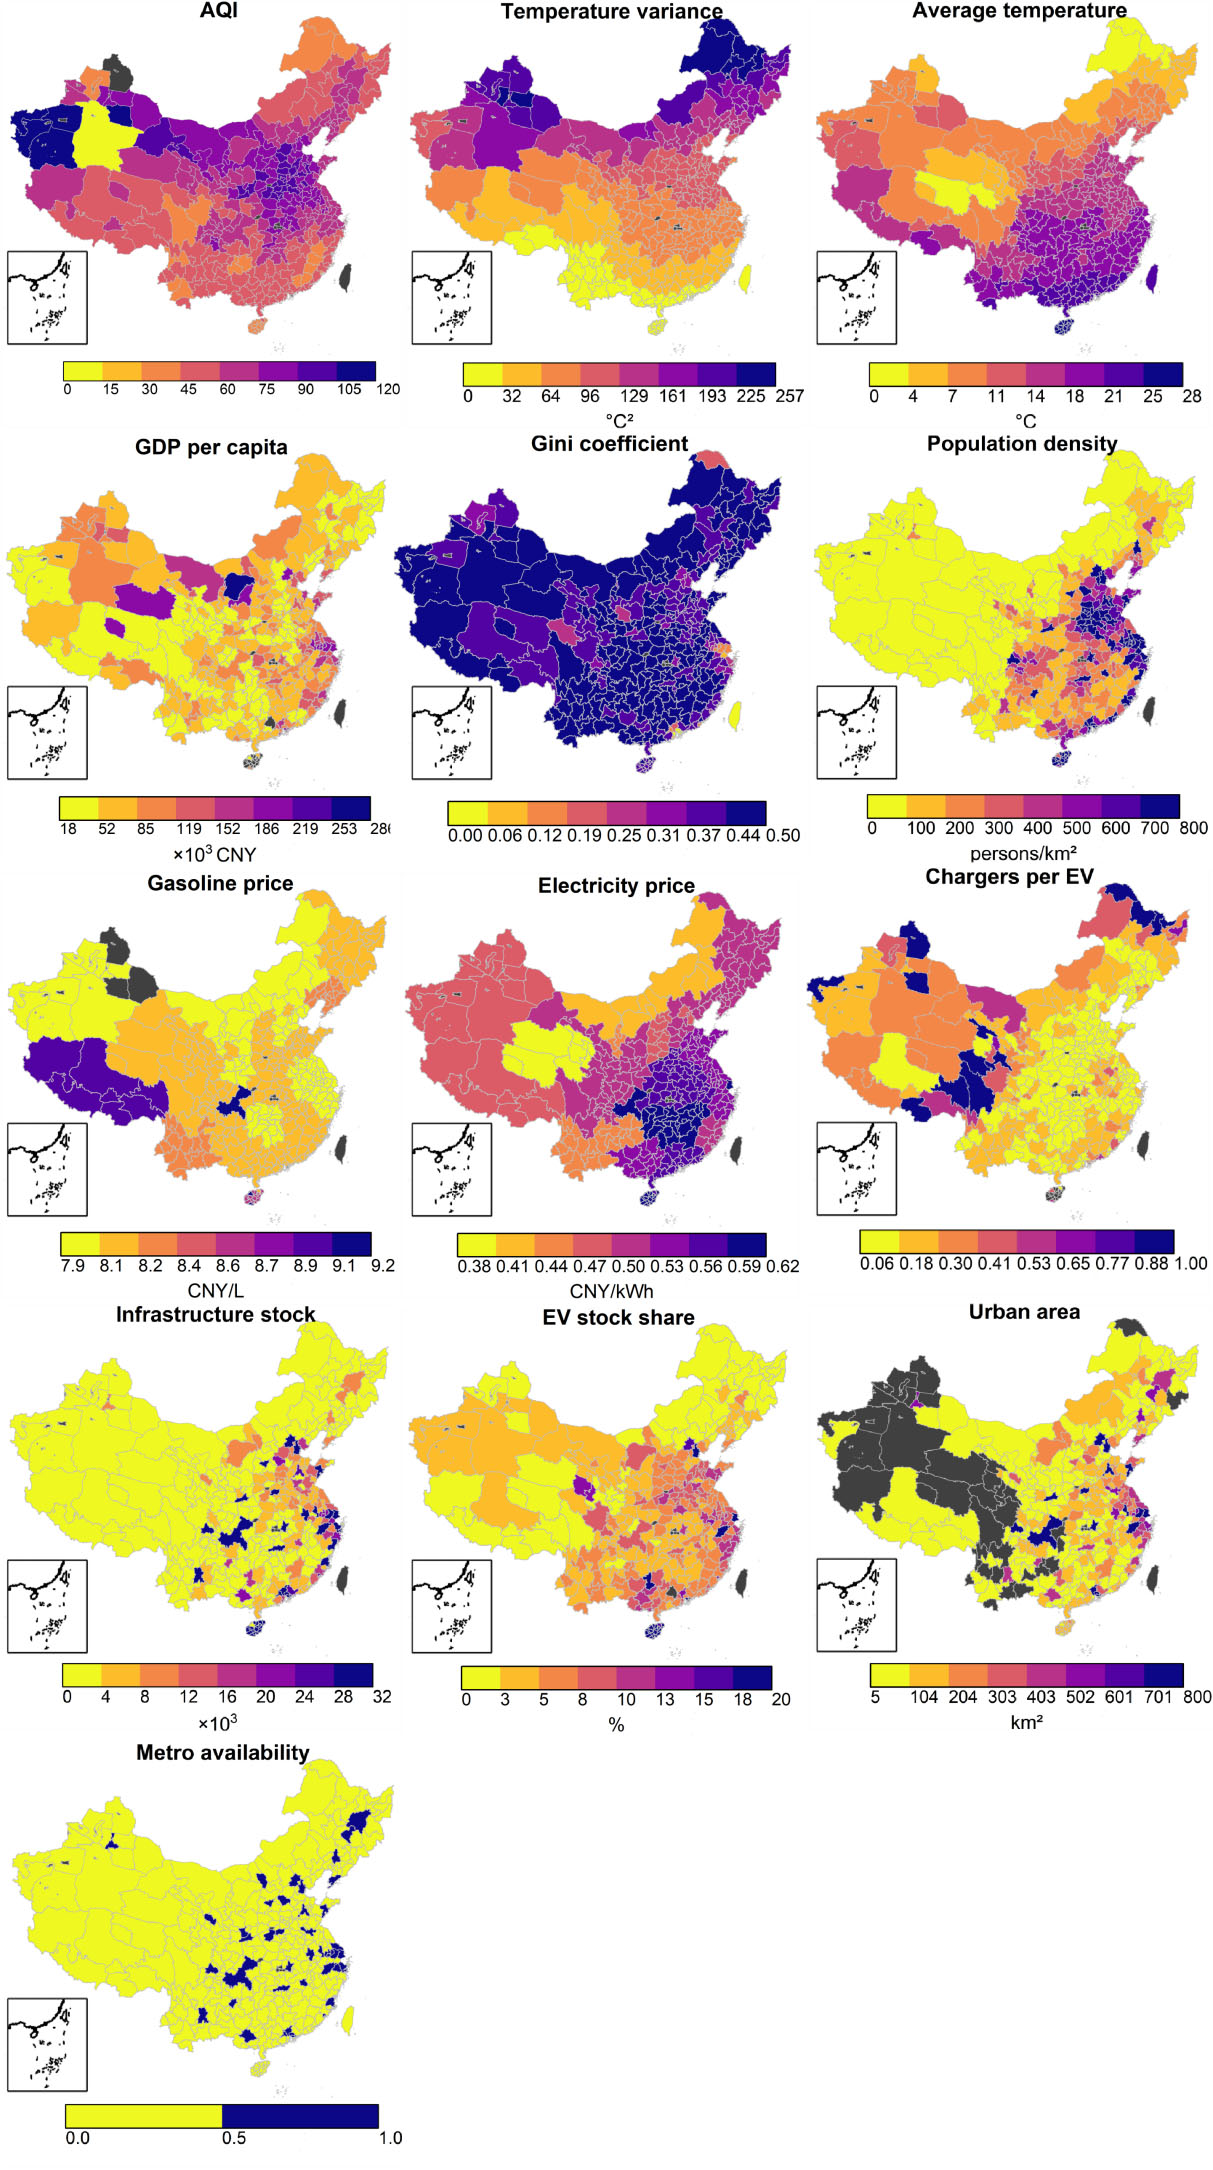
Figure 4. Spatial distribution of the 13 predictors retained in the final model across 296 Chinese prefecture-level cities in 2024. Each panel presents the spatial distribution of one predictor. Color bars indicate the values and units of the corresponding variables. Gasoline and electricity prices are measured at the provincial level and uniformly assigned to cities within each province. Metro availability is a binary variable, where 1 indicates the presence of an operating metro system, and 0 indicates its absence. Grey areas represent cities not included in the final analytical sample. The base map was derived from the standard map of China approved under map approval number GS(2019)1822 and obtained from the Standard Map Service System of the Ministry of Natural Resources of the People’s Republic of China(http://bzdt.ch.mnr.gov.cn/download.html?searchText=GS(2019)1822). The base map boundaries were not modified. AQI: Air quality index.
Based on this integrated dataset, we applied the RF model to all cities to capture the key predictors of EV penetration in China. Hyperparameters were selected by grid search based on OOB error, and the final model was constructed with 1,000 trees, six variables randomly selected at each split, and a minimum node size of one. Model validation employed a city-grouped design, with 80% of cities used for training and the remaining 20% held out entirely. The RF model demonstrated strong predictive performance, explaining 92.5% of the variance in OOB evaluation on the training cities. On the held-out cities, the model achieved an R2 of 0.902, with a RMSE of 0.048 and a mean absolute error of 0.027, indicating that predictive skill extends to cities never seen during training. A complementary random observation-level split yielded a test R2 of 0.941 [Supplementary Table 4], confirming that performance is not sensitive to the validation design.
To interpret the fitted model, we computed SHAP values for all observations. SHAP values quantify the contribution of each variable to individual predictions relative to the average prediction, and therefore describe predictive associations rather than causal effects. The global SHAP importance ranking [Figure 5A] closely matches the permutation-based ranking (Section Uncertainty in variable importance), indicating that the identified importance structure is not an artifact of any single metric. The EV stock share emerges as the dominant feature, followed by gasoline price, infrastructure stock, and average temperature. The SHAP beeswarm plot [Figure 5A] further reveals the direction of these associations, with higher values of EV stock share, gasoline price, infrastructure stock, and temperature contributing positively to predicted penetration.
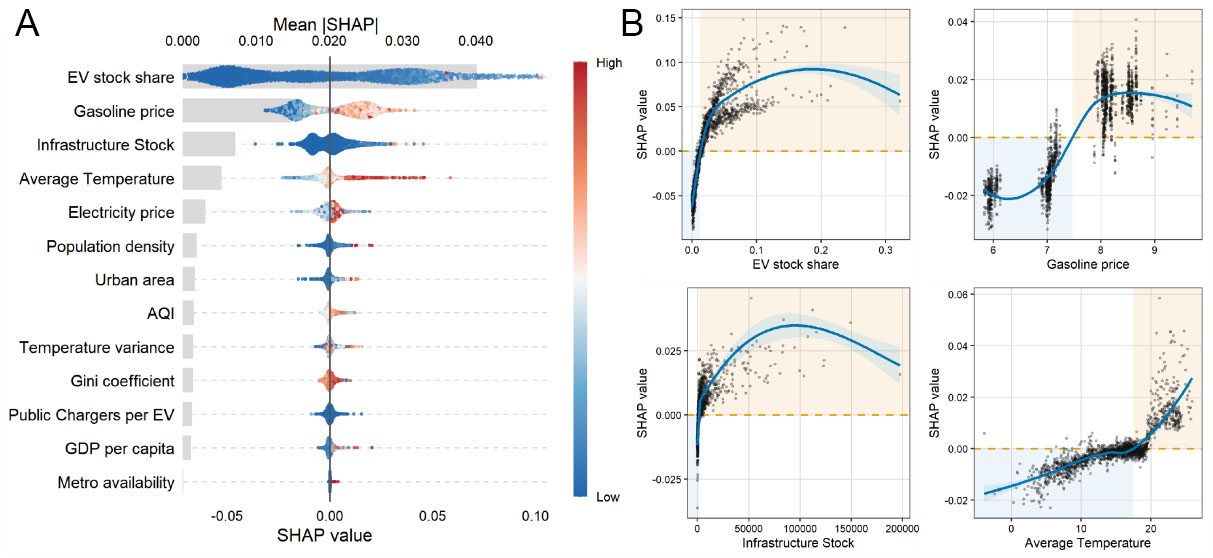
Figure 5. SHAP-based interpretation of the final random forest model. (A) SHAP summary plot for all 13 substantive predictors. Calendar year was included as a categorical control in the model but is omitted from the display. The grey bars represent the mean absolute SHAP values, while each point represents one city-year observation. Point color indicates the normalized feature value, ranging from low (blue) to high (red). Predictors are ranked according to their mean absolute SHAP values; (B) SHAP dependence plots for the four predictors with the highest point estimates of mean absolute SHAP importance: EV stock share, gasoline price, infrastructure stock, and average temperature. Black points represent individual observations, blue curves show LOESS-smoothed relationships with 95% confidence intervals, and orange dashed lines indicate a SHAP value of zero. EV: Electric vehicle; AQI: air quality index; SHAP: SHapley Additive exPlanations.
Figure 5B illustrates the SHAP dependence plots for the top four substantive variables with the highest point estimates of mean absolute SHAP importance: EV stock share, gasoline price, infrastructure stock, and average temperature. The complete set of SHAP dependence plots for all variables is available in Supplementary Figure 2. All four variables show positive associations with predicted EV penetration, with higher values yielding positive SHAP contributions. These plots also reveal highly nonlinear relationships between the predictors and EV penetration rates, including steep marginal contributions at low EV stock share values that flatten as local fleets mature, underscoring the advantage of RF in capturing complex, non-monotonic patterns.
Among all factors, EV stock share, calculated as the proportion of EVs in a city’s total vehicle fleet, emerges as the most influential predictor, showing strong and consistent effects across both national and regional models. This variable summarizes the prevalence of EVs in the local vehicle fleet and potentially reflects the social exposure of EVs in daily life[25,27]. Following EV stock share, gasoline prices also play important roles, capturing the operating cost considerations of potential EV buyers. As fuel prices rise, EVs become more economically attractive relative to conventional vehicles. Charging infrastructure stock ranks third, and its position is highly stable across bootstrap replicates (Section Uncertainty in variable importance), although its importance is markedly lower than that of the top two higher-ranked features. Additionally, temperature also proves influential: cold weather reduces battery performance and range, potentially deterring adoption. The remaining predictors, including electricity price, population density, the Gini coefficient, and air quality, form a lower tier whose internal ordering is not statistically distinguishable
Regional heterogeneity analysis
In a geographically and climatically diverse country like China, patterns of EV adoption may exhibit substantial regional heterogeneity due to variations in economic development, climate, and cultural factors. To account for this heterogeneity, we grouped Chinese cities into four broad regions, following commonly adopted geographic and administrative conventions: Northeast, East, Central, and West, as shown in Figure 6A. Cities within each region typically share similar socioeconomic development levels and are often interconnected through regional urban clusters. This classification enables a more context-specific analysis of influencing factors while minimizing confounding effects from omitted variables. Meanwhile, substantial differences in other relevant factors still exist across cities within and between these regions. To assess the validity of this regional classification, a one-way ANOVA followed by Tukey’s HSD post-hoc tests was conducted on city-level mean values of all 13 variables, with p-values adjusted for the family of pairwise comparisons within each variable. All 13 variables exhibited statistically significant overall differences across the four regions (P < 0.01; Supplementary Table 5), and 57.7% of the 78 pairwise regional comparisons were significant at the adjusted 0.01 level (62.8% at the 0.05 level; Supplementary Table 6), indicating substantial differences among the four regions and justifying the use of stratified modeling in the subsequent analysis.
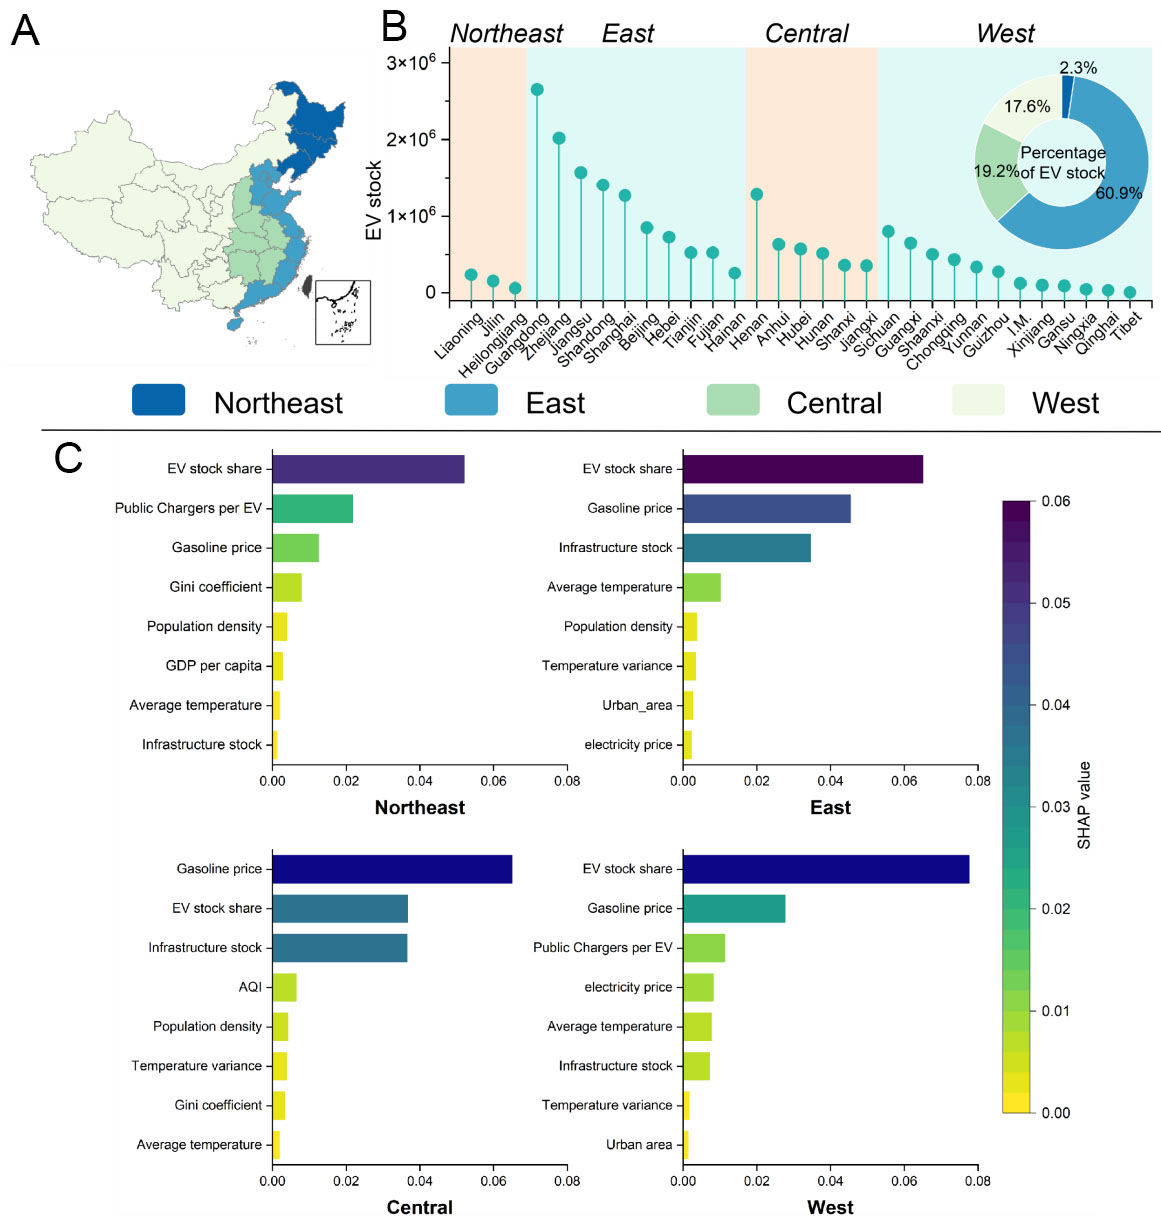
Figure 6. Regional classification and regional variation in key predictors of EV penetration. (A) Geographic distribution of the four regions: Northeast, East, Central, and West; (B) Total EV stock by province and the regional share of national EV stock in 2024; (C) Mean absolute SHAP values of the top eight predictors in each of the four region-specific random forest models. The geographic base maps were derived from the standard map of China approved under map approval number GS(2019)1822 and obtained from the Standard Map Service System of the Ministry of Natural Resources of the People’s Republic of China(http://bzdt.ch.mnr.gov.cn/download.html?searchText=GS(2019)1822). The base map boundaries were not modified. EV: Electric vehicle; AQI: air quality index; SHAP: SHapley Additive exPlanations.
The Northeast region consists of Heilongjiang, Jilin, and Liaoning provinces in northern China [Supplementary Table 7]. In 2024, the region had the lowest mean annual temperature among the four regions, at 8.0 °C, which may adversely affect battery performance and EV adoption. Its average EV penetration rate was 29.1%, compared with 45.8% in the East. The Northeast also lagged considerably in economic development and charging infrastructure: its average GDP per capita was CNY 57,479, and cities in the region had an average of 1,783 public charging points, substantially below the corresponding values in the East. The East region includes several coastal provinces and economically developed areas such as Beijing, Shanghai, Zhejiang, and Guangdong. It accounted for 60.9% of the total EV stock in China, equivalent to approximately 11.79 million EVs - more than all other regions combined [Figure 6B]. Its average GDP per capita reached CNY 109,378, approximately 1.9 times that of the Northeast and 1.4 times that of the West. The East also recorded the highest average EV penetration rate (45.8%), EV stock share (8.7%), mean annual temperature (18.5 °C), and availability of charging infrastructure among the four regions. The Central region comprises predominantly inland provinces. In 2024, it had approximately 3.72 million EVs, representing 19.2% of China’s total EV stock, and an average EV penetration rate of 41.4%. Its average GDP per capita was CNY 78,447, while cities in the region had an average of 8,043 public charging points. The West region comprises 94 cities in the analytical sample and is characterized by relatively low population density and economic development compared with the East. It contained approximately 3.40 million EVs, accounting for 17.6% of China’s total EV stock. Its average EV penetration rate was 35.0%, with an average GDP per capita of CNY 75,566 and an average of 4,886 public charging points per city.
To further explore regional heterogeneity, we applied the RF model separately to the four geographic regions. The models performed well across all regions, explaining 91.2% of the variance in the Northeast region (OOB RMSE = 0.035), 94.0% in the East region (OOB RMSE = 0.042), 95.6% in the Central region (OOB RMSE = 0.032), and 93.4% in the West region (OOB RMSE = 0.039).
The regional SHAP results reveal both strong commonalities and instructive geographic differences in the factors influencing EV penetration [Figure 6C]. EV stock share is the most influential predictor in the Northeast, East, and West, whereas gasoline price ranks first in the Central region and second in the East and West. Charging-related factors also vary across regions. Public chargers per EV rank second in the Northeast, ahead of gasoline price, and third in the West. By contrast, the total stock of charging infrastructure is among the three leading predictors in the East and Central regions. AQI has a comparatively greater contribution in the Central region but is less influential elsewhere. Average temperature ranks fourth in the East and has a relatively limited contribution in the other regions. Overall, EV stock share, fuel costs, and charging infrastructure are important across China, but their relative contributions differ by region. These findings support region-specific policies, particularly improvements in charging accessibility in the Northeast and differentiated measures addressing fuel costs, charging-network expansion, and environmental conditions in other regions. The SHAP results reflect model-derived associations rather than causal effects.
Uncertainty in variable importance
To assess the stability of importance rankings under sampling variation, Figure 7 reports mean absolute SHAP importance of the substantive predictors with 95% city-block bootstrap confidence intervals (300 replicates, resampling cities with replacement while retaining all years of each sampled city). The estimates form clearly separable tiers, and the top rank order is fully stable. EV stock share ranks first in 100% of replicates, with a confidence interval separated from gasoline price and all predictors below. Gasoline price occupies a stable second position among the substantive predictors, and a statistically clean break separates it from charging infrastructure stock, whose interval does not overlap with that of any higher-ranked predictor. Infrastructure stock in turn holds the third rank in 98% of replicates. By contrast, the confidence intervals of the remaining predictors, from average temperature through urban area, overlap in an unbroken chain, indicating that their relative ordering is not statistically distinguishable at conventional levels; metro availability ranks clearly last. Accordingly, we interpret variable importance at the tier level throughout, and refrain from concluding the ordering of predictors within the overlapping middle tier. Permutation-based and SHAP-based rankings agree closely (Spearman ρ = 0.90 in the main model and 0.84 when EV stock share is excluded; Supplementary Table 8), confirming that these conclusions are not specific to a single importance metric.
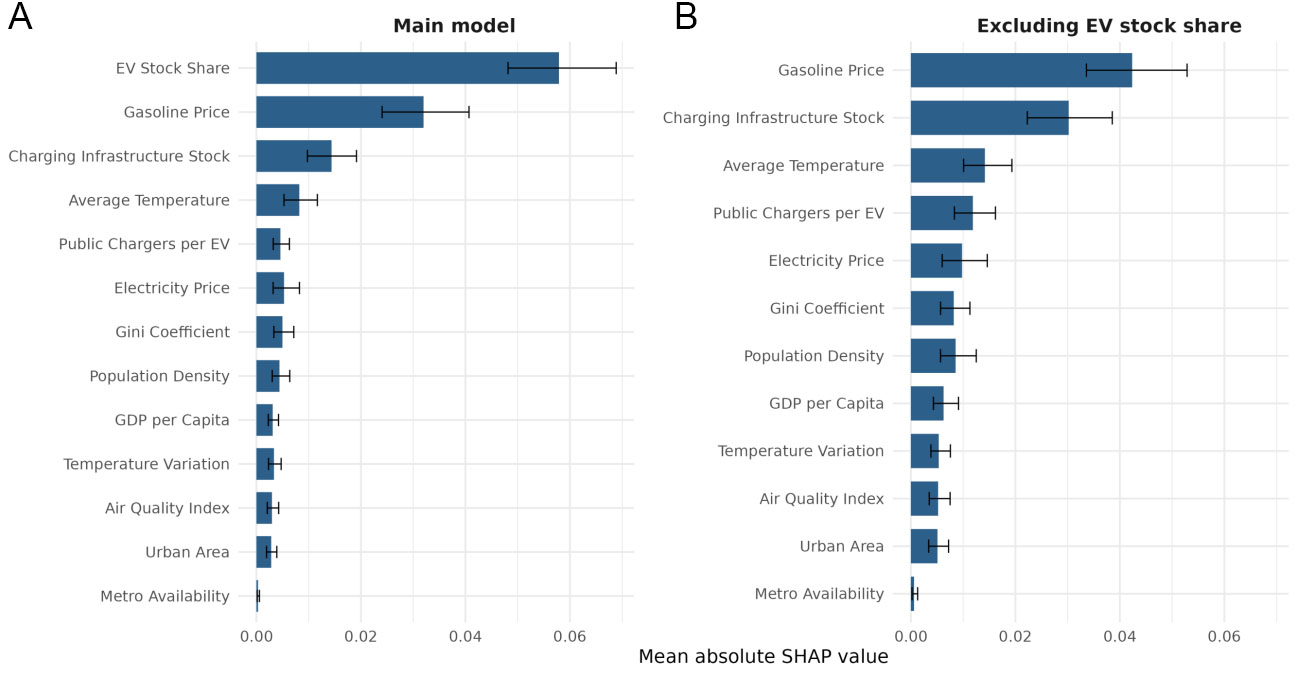
Figure 7. Bootstrap uncertainty in variable importance. Mean absolute SHAP values of the substantive predictors with 95% confidence intervals from 300 city-block bootstrap replicates, for (A) the main model and (B) the specification excluding EV stock share. In each replicate, cities were resampled with replacement and all years of each sampled city were retained, preserving within-city temporal correlation. The model was then refitted and mean absolute SHAP importance was recomputed. Bars show the mean across replicates, and error bars indicate the 2.5th to 97.5th percentile range. Calendar-year indicators were included in all model fits as trend controls but are omitted from the display, which ranks substantive predictors only. EV: Electric vehicle; SHAP: SHapley Additive exPlanations.
DISCUSSION AND CONCLUSION
Using city-level data from 296 Chinese cities between 2019 and 2024, this study examined the spatial and temporal patterns of EV penetration and its associated factors using an interpretable random forest framework. EV adoption expanded beyond the early-leading coastal cities, although substantial regional differences remained. The model achieved an R2 of 0.902 for cities excluded from training. EV stock share was the dominant substantive predictor, largely reflecting adoption momentum and path dependency, followed by gasoline price and charging infrastructure stock. Regional models showed that EV stock share led in the Northeast, East, and West, while gasoline price ranked first in the Central region and charging-related variables were more prominent in the Northeast and West. The following subsections interpret these findings in relation to previous literature and discuss their broader implications.
EV stock share: adoption momentum as a leading signal
The share of EVs in a city’s existing vehicle fleet (EV stock share) emerged as the most important predictor of EV penetration in China, with consistent results across national and in the Northeast, East, and West regional models, as well as across permutation-based and SHAP-based importance measures. However, the interpretation of this variable warrants careful consideration, as it may capture several intertwined aspects of local market development.
A first interpretation, common in the technology-diffusion literature, links the prevalence of EVs in the local environment to social exposure and peer influence. Prior research has highlighted the relevance of social influence in shaping consumer adoption behavior[28]. Axsen and Kurani[29] emphasized the interpersonal dynamics between early adopters and subsequent users in the diffusion of emerging technologies. As consumers gain exposure to new technologies in their local environment, their preferences between conventional and alternative technologies may shift, and the value they assign to attributes such as environmental benefits or cost savings tends to evolve as the technology becomes more widespread. Empirical studies in the automotive sector support this mechanism, including early work on hybrid and hydrogen fuel cell vehicles[27], spatial peer-effect analyses of hybrid vehicle adoption at the neighborhood level[30], and recent evidence from Norway linking increased EV adoption to the influence of existing users[31].
A second, more parsimonious interpretation is that a high EV stock share simply reflects the accumulated outcome of past adoption, that is, adoption momentum or path dependency, rather than an independently operating behavioral mechanism. Because the EV stock share is by construction an integral of historical EV purchases, cities with high current stock shares are necessarily cities where penetration has been high in preceding years, and year-to-year persistence alone could account for much of this variable’s predictive power.
Our robustness analyses indicate that the second interpretation accounts for the larger part of the observed importance. Year-to-year persistence in penetration is itself very strong in our panel, with a first-order autocorrelation of 0.955. When the model was re-estimated with a one-year-lagged penetration rate included in place of EV stock share (Section Random forest modeling and interpretation), the lagged term became the most important predictor (%IncMSE = 84.3), approximately three times that of the next-ranked predictor [Supplementary Table 9]. Moreover, the elevated importance that infrastructure-related variables and GDP per capita displayed when EV stock share was excluded reverted to or below baseline levels once the lagged penetration rate was included, suggesting that these variables had partly served as substitute proxies for the same underlying persistence signal. Block-bootstrap confidence intervals confirm that EV stock share’s top-tier importance is statistically robust, but they cannot, by themselves, attribute this importance to a specific behavioral channel.
Taken together, these results suggest that EV stock share is best understood as an indicator of local market maturity and adoption momentum, within which social-exposure effects documented in the diffusion literature are plausibly embedded but cannot be separately identified with the present observational design. This interpretation remains consequential for both modeling and policy. For modeling, it implies that projections which ignore the self-reinforcing character of local adoption, whether its proximate mechanism is behavioral contagion, complementary infrastructure development, or both, are likely to systematically underestimate uptake in early-leading cities, which may help explain why EV adoption in China has repeatedly outpaced projections from static models. For policy, path dependency implies that early interventions in lagging regions may yield compounding long-run returns, a point we return to in Section Policy and carbon-footprint implications. Distinguishing the specific contribution of peer exposure from other components of adoption momentum would require exogenous measures of social exposure (for example, media coverage or search-interest indices at the city level), which we identify as a priority for future research.
The role of energy prices
Higher gasoline prices are associated with greater economic competitiveness of EVs, while declining battery costs correlate with improved affordability and broader consumer access. The influence of gasoline prices on vehicle purchase behavior has been widely examined in prior research. While gasoline prices are typically not set with the explicit aim of encouraging EV penetration, empirical studies consistently reveal a significant association between higher gasoline prices and increased EV market share 32. In our models, gasoline price is the second-ranked substantive predictor nationally and remains among the leading predictors in every region. As gasoline prices in China are administered at the provincial level and move largely in tandem nationwide, this association primarily reflects the operating-cost environment consumers face rather than fine-grained cross-city variation. However, in the Chinese context, leveraging fuel price adjustments as a policy tool to encourage EV uptake appears increasingly infeasible. Since the 2019 issuance of the “Central Pricing Catalogue” by the National Development and Reform Commission, China’s fuel pricing system has been on a path toward full market liberalization[33]. This shift reduces the scope for direct government intervention in gasoline pricing and limits its utility as a deliberate mechanism for promoting EV sales. Therefore, while gasoline prices remain a strong explanatory variable, particularly reflecting operational cost competitiveness, they are unlikely to serve as a targeted policy lever in China’s future EV strategies.
Electricity price, the operating-cost counterpart of gasoline price, occupies the statistically indistinguishable middle tier nationally (Section Uncertainty in variable importance) but enters the leading regional predictors in the West, where it ranks fourth among substantive variables (Section Regional heterogeneity analysis). This regional prominence is consistent with charging costs weighing more heavily on adoption decisions in a region where incomes are lower and long travel distances raise the salience of per-kilometer operating costs, although, as with all importance estimates in this study, the association is predictive rather than causal. Battery costs, by contrast, are national in scope: as the single most expensive vehicle component, accounting for 30%-40% of total vehicle cost[34], their substantial decline over the study period has been a major force behind improving EV affordability, but because this decline is common to all cities, it is absorbed by the calendar-year controls rather than attributed to any city-level predictor (Section Random forest modeling and interpretation).
The nuanced role of public charging infrastructure
Previous studies widely suggest that the availability of charging infrastructure plays a critical role in alleviating consumers’ range anxiety and enhancing their willingness to adopt EVs[24]. In our national model, charging infrastructure stock ranks third among substantive predictors, yet its importance is markedly smaller in magnitude than that of EV stock share and gasoline price, a gap that is larger than the prior literature would suggest. One plausible explanation for this relatively modest effect is the widespread availability of residential charging among Chinese EV users, which may reduce their marginal reliance on public charging infrastructure. Supporting this interpretation, a survey-based structural equation modeling study found that public charging density was neither directly nor indirectly associated with consumers’ consideration of purchasing an EV[35], suggesting that expanding public charging availability does not necessarily translate into stronger purchase intentions. In the Chinese context, the IEA reports that around 50% of EV owners have home chargers, while a further one-third have access to shared residential charging facilities, such as chargers located in apartment-complex parking areas[36]. The widespread availability of residential charging may therefore reduce dependence on public charging infrastructure and help explain its relatively limited contribution to EV penetration. In 2023, China’s urban charging infrastructure continued its rapid expansion. The total number of chargers increased from 5.2 million in 2022 to 8.56 million in 2023 - an annual growth rate exceeding 64%. Notably, private chargers accounted for the majority of this expansion, contributing 2.458 million units or 72.6% of the total increase. The share of private chargers rose from 65.5% in 2022 to 68.0% in 2023[37], underscoring the dominant role of residential infrastructure in supporting EV penetration in China.
On the other hand, caution is warranted when interpreting the causal relationship between public charging infrastructure and EV adoption. As highlighted in prior literature, the correlation between infrastructure availability and EV uptake may reflect a “chicken-and-egg” dilemma[26,32], where it is unclear whether charging stations drive sales or simply follow demand. In practice, charging infrastructure is often deployed in regions where EV adoption is already high. This pattern is confirmed in our analysis, which shows a strong positive correlation between the number of public chargers and EV stock (r = 0.88, Supplementary Figure 1), suggesting that infrastructure deployment may be more reactive than proactive. Consistent with this reactive pattern, the ratio of public chargers to EVs is negatively associated with penetration in our data: provision-rich, low-penetration cities are typically early-stage markets in which publicly led deployment precedes demand, reinforcing the interpretation that public charger construction follows rather than leads adoption at the city level.
Consequently, while public infrastructure may not emerge as a primary factor of EV penetration nationwide, its role remains crucial in specific regions - particularly in areas where home charging is less feasible or where range anxiety is more prevalent, such as high-density urban centers or the Northeast. Therefore, a more nuanced infrastructure strategy that balances public and private investments based on local context is essential for sustaining long-term EV adoption.
Other influencing factors
In addition to the key variables discussed above, several other factors included in the model, such as socioeconomic factors and environmental factors, also exhibit varying degrees of association with EV penetration. As established in Section Uncertainty in variable importance, the predictors discussed in this subsection belong to a middle tier whose internal ordering is not statistically distinguishable. We therefore characterize their roles qualitatively rather than by precise rank. Temperature, a factor that has received relatively limited attention in prior studies, sits at the top of this middle tier in a geographically diverse country like China, which spans multiple climatic zones. Low temperatures are associated with reduced battery performance and driving range, which may correlate with lower rates of EV adoption. GDP per capita also shows a positive association with EV penetration in our model, consistent with previous studies suggesting that higher income levels correlate with greater household purchasing power and more developed urban infrastructure. However, GDP per capita did not emerge as a top-ranking variable, plausibly because its correlation with other predictors such as EV stock share and charging infrastructure, which more directly summarize local market conditions, channels its explanatory content through them. In terms of air quality, the composite AQI was retained at the screening stage in place of individual pollutant concentrations. AQI likewise falls within the middle tier nationally, but ranks among the top five substantive predictors in the Central region, plausibly reflecting the region’s more severe pollution levels, which may motivate both stronger local promotion efforts and consumer preferences toward cleaner vehicles. Prior studies have similarly noted that environmental awareness, though relevant, is often outweighed by cost and convenience considerations in shaping purchase decisions.
The Gini coefficient falls within the middle tier nationally yet enters the top five substantive predictors in the Northeast (Section Regional heterogeneity analysis); together with the prominence of charger provision there, this pattern is consistent with the qualitatively different dynamics of an earlier-stage market, although we refrain from a stronger interpretation given the overlapping confidence intervals. The urban-form variables (population density, urban area, and metro availability) contribute little additional predictive content once market-maturity and infrastructure conditions are accounted for, with metro availability ranking clearly last.
Overall, while these additional variables do not emerge as the dominant factors in our analysis, they provide important contextual information and help reinforce the robustness of the modeling framework. Their inclusion contributes to a more comprehensive understanding of the various forces shaping EV adoption in China.
Policy and carbon-footprint implications
Our analysis shows that EV adoption expanded beyond the early-adopting southeastern coastal cities into a broader range of cities in the Central and Western regions, while substantial regional differences persisted. Among the predictors examined, EV stock share and gasoline price rank as the most strongly associated with EV penetration, alongside the common temporal trend captured by the year effects. EV stock share, measured by the proportion of electric vehicles in a city’s overall vehicle fleet, consistently ranks as the top substantive predictor in the national and in the Northeastern, Eastern, and Western regional random forest models, whereas gasoline price ranks first in the Central region. This finding underscores the strongly self-reinforcing, path-dependent character of local EV adoption. Interestingly, the influence of public charging infrastructure is smaller in magnitude at the national level than commonly assumed. However, infrastructure-related variables gain prominence in specific regional contexts. In the East and Central regions, charging infrastructure stock ranks among the top three substantive predictors, whereas in the Northeast, the public charger-to-EV ratio enters the leading predictors, consistent with the earlier market phase of Northeastern cities where publicly led deployment still runs ahead of adoption (Section Regional heterogeneity analysis). This regional pattern is consistent with public charging availability playing a larger role where private charging options and market fundamentals are weaker; however, because charging infrastructure deployment in China is itself partly policy-driven, this association should be read as identifying where infrastructure and adoption move together most strongly, rather than as direct evidence that infrastructure investment causes adoption.
From a carbon-footprint perspective, these regional findings carry implications that go beyond the observation that lagging regions hold mitigation potential. China’s transportation sector contributed approximately 10% of national carbon emissions in 2021, with road transportation accounting for 86.8% of transport-sector emissions[38], so closing regional penetration gaps could contribute meaningfully to China’s carbon neutrality target by 2060. Crucially, however, the carbon value of an additional percentage point of penetration is not uniform across regions, because the use-phase emissions of an EV depend on the carbon intensity of the electricity that charges it, which varies severalfold across China’s regional grids[39]. Combining this with our empirical results yields a policy-relevant asymmetry between the two lagging regions our models identify. In the West, where several provinces enjoy hydropower-rich, low-carbon electricity supply, accelerating EV penetration delivers comparatively large and immediate per-vehicle emission reductions. In the Northeast, by contrast, coal-intensive grids and cold climates that raise EV energy consumption imply smaller near-term per-vehicle benefits, and the carbon case for EV promotion there rests on parallel progress in grid decarbonization. Regional EV-promotion strategies motivated by our findings should therefore be sequenced with regional grid carbon intensity in view, rather than treating a percentage point of penetration as carbon-equivalent everywhere. Two caveats bound this discussion: our penetration data do not distinguish battery electric from plug-in hybrid vehicles, whose realized savings depend heavily on the electric driving share; and a full accounting would require life-cycle system boundaries and dynamic grid factors. Estimating avoided emissions under explicit regional adoption scenarios, with grid intensity and powertrain mix resolved, is the future extension of this work.
Our findings identify EV stock share, gasoline price, infrastructure availability, and climatic conditions as the predictors most strongly associated with regional EV penetration. While these associations cannot be interpreted as causal effects, they nonetheless offer suggestive evidence to inform further policy-relevant investigation, particularly where corroborated by the robustness and uncertainty analyses reported in Sections Uncertainty in variable importance and EV stock share: adoption momentum as the dominant signal. The findings may also provide contextual insights for other countries, particularly emerging markets seeking to understand EV adoption under diverse local conditions.
Limitations and future research
Several limitations of this study should be acknowledged. First, explicit policy variables were not included because a consistent city-year policy dataset could not be assembled. Calendar-year indicators capture temporal changes common to all cities, including those associated with national policies, but they cannot identify the effects of specific policy instruments. Persistent local policies may be partly reflected in the adoption-momentum signal, while time-varying policies, such as local incentives and charging-infrastructure mandates, remain unobserved. The importance assigned to EV stock share, charging infrastructure, and other correlated predictors may therefore partly reflect differences in local policy exposure. Second, this study is observational and predictive rather than causal. Random forest importance and SHAP values describe how predictors contribute to model predictions, but they do not identify the causal effect of changing any individual factor. Reverse causality, predictor endogeneity, and unobserved confounding cannot be ruled out. The bootstrap analysis and alternative model specifications quantify uncertainty and sensitivity, but they do not provide causal identification. The policy implications should therefore be interpreted as hypotheses for further investigation rather than evidence of intervention effects. Third, the outcome variable combines BEVs and PHEVs, although their adoption dynamics and carbon implications may differ, and excludes FCVs because their market share was negligible during the study period. The relatively short period from 2019 to 2024 also limits our ability to examine the early development and long-term evolution of the EV market. In addition, the four-region classification may obscure heterogeneity within individual regions. Future research should develop a consistent city-level policy database and, where suitable policy variation is available, apply causal designs to distinguish policy effects from market maturity and infrastructure development. Longer time series, powertrain-specific penetration measures, more detailed regional classifications, and additional behavioral and economic variables would further improve the analysis.
DECLARATIONS
Authors’ contributions
Writing - original draft, methodology, visualization: Deng, Y.
Review and supervision: Hao, H.
Conceptualization, writing - review and editing: Sun, X.
Review and editing, methodology: Zhao, B.
Data collection, writing - review and editing: Dou, H.; Mai, L.; Deng, H.
Availability of data and materials
The data supporting the findings of this study are presented in this manuscript and Supplementary Materials.
AI and AI-assisted tools statement
Not applicable.
Financial support and sponsorship
This study is sponsored by the National Natural Science Foundation of China (72122010), National Key R&D Program of China (2019YFC1908501), supported by Carbon Neutrality and Energy System Transformation (CNEST) Program led by Tsinghua University, and International Joint Mission on Climate Change and Carbon Neutrality.
Conflicts of interest
Hao, H. is the Associate Editor of Carbon Footprints journal. He had no involvement in the review or editorial process of this manuscript, including but not limited to reviewer selection, evaluation, or the final decision, while the other authors have declared that they have no conflicts of interest.
Ethical approval and consent to participate
Not applicable.
Consent for publication
Not applicable.
Copyright
© The Author(s) 2026.
Supplementary Materials
REFERENCES
1. IPCC. Mitigation of Climate Change 2023. https://www.ipcc.ch/report/ar6/syr/ (accessed on 2026-8-17).
2. Hao, H.; Geng, Y.; Tate, J. E.; et al. Impact of transport electrification on critical metal sustainability with a focus on the heavy-duty segment. Nat. Commun. 2019, 10, 5398.
3. IEA. Global EV Outlook 2025. 2025. https://www.iea.org/reports/global-ev-outlook-2025 (accessed on 2026-8-17).
4. Liu, M.; Hao, H.; Sun, X.; et al. The potential for differentiated vehicle segment tariffs. Nat. Energy. 2025, 10, 1042-4.
5. Dou, H.; Hao, H.; Mai, L.; Liu, B.; Liu, M.; Sun, X. Observed constrained expansion and diminished affordability under the EU’s tariffs on Chinese electric vehicles. Joule 2026, 10, 102486.
6. Dou, H.; Jiang, S.; Ou, S. S.; et al. Managing the impacts of EU electric vehicle import tariffs. Nat. Energy. , 2026, 1-3.
7. Dou, H.; Jiang, S.; Ou, S. S.; et al. Distributional impacts of EU tariffs on Chinese electric vehicles across European markets. Nat. Energy..
8. Deng, Y.; Hao, H.; Jia, C. Exploring the potential of cutting battery use in electric vehicles. Clean. Techn. Environ. Policy. 2024, 26, 367-79.
9. Li, X.; Yan, X. Regional prioritization in vehicle electrification and renewable electricity expansion facilitates decarbonization of China’s road transport. Carbon. Footprints. 2025, 4, 32.
10. Brückmann, G.; Willibald, F.; Blanco, V. Battery Electric Vehicle adoption in regions without strong policies. Transport. Res. D-Tr. E. 2021, 90, 102615.
11. Forsythe, C. R.; Gillingham, K. T.; Michalek, J. J.; Whitefoot, K. S. Technology advancement is driving electric vehicle adoption. Proc. Natl. Acad. Sci. U. S. A. 2023, 120, e2219396120.
12. Javid, R. J.; Nejat, A. A comprehensive model of regional electric vehicle adoption and penetration. Transport. Policy. 2017, 54, 30-42.
13. Austmann, L. M. Drivers of the electric vehicle market: a systematic literature review of empirical studies. Financ. Res. Lett. 2021, 41, 101846.
14. Maybury, L.; Corcoran, P.; Cipcigan, L. Mathematical modelling of electric vehicle adoption: a systematic literature review. Transport. Res. D-Tr. E. 2022, 107, 103278.
15. Li, X.; Chen, P.; Wang, X. Impacts of renewables and socioeconomic factors on electric vehicle demands - panel data studies across 14 countries. Energy. Policy. 2017, 109, 473-8.
16. Lv, R.; Li, B.; Li, M.; et al. Heterogeneous impact of public charging infrastructure on electric vehicle purchases. J. Technol. Econ. 2023, 42, 143-54.(in Chinese).
17. Shang, W.; Zhang, J.; Wang, K.; Yang, H.; Ochieng, W. Can financial subsidy increase electric vehicle (EV) penetration - evidence from a quasi-natural experiment. Renew. Sust. Energ. Rev. 2024, 190, 114021.
18. Hu, L.; Deng, S.; Ma, J.; et al. Informing risk hotspots and critical mitigations for rainstorms using machine learning: evidence from 268 Chinese cities. Environ. Sci. Technol. 2025, 59, 1619-30.
19. Yang, J.; Wen, Y.; Wang, Y.; et al. From COVID-19 to future electrification: assessing traffic impacts on air quality by a machine-learning model. Proc. Natl. Acad. Sci. U. S. A. 2021, 118.
20. Bas, J.; Cirillo, C.; Cherchi, E. Classification of potential electric vehicle purchasers: a machine learning approach. Technol. Forecasting. Social. Change. 2021, 168, 120759.
21. Shehabeldeen, A.; Mohamed, M. Factors influencing electric vehicle adoption: coupling machine learning models and open-source data. Technol. Forecast. Soc. 2026, 2680, 948-66.
22. Priessner, A.; Sposato, R.; Hampl, N. Predictors of electric vehicle adoption: an analysis of potential electric vehicle drivers in Austria. Energy. Policy. 2018, 122, 701-14.
23. Singh, V.; Singh, V.; Vaibhav, S. A review and simple meta-analysis of factors influencing adoption of electric vehicles. Transport. Res. D-Tr. E. 2020, 86, 102436.
24. Kumar, R. R.; Alok, K. Adoption of electric vehicle: a literature review and prospects for sustainability. J. Clean. Prod. 2020, 253, 119911.
25. Mukherjee, S. C.; Ryan, L. Factors influencing early battery electric vehicle adoption in Ireland. Renew. Sust. Energ. Rev. 2020, 118, 109504.
26. Liu, X.; Sun, X.; Zheng, H.; Huang, D. Do policy incentives drive electric vehicle adoption? Transport. Res. A-Pol. 2021, 150, 49-62.
27. Mau, P.; Eyzaguirre, J.; Jaccard, M.; Collins-Dodd, C.; Tiedemann, K. The ‘neighbor effect’: simulating dynamics in consumer preferences for new vehicle technologies. Ecol. Econ. 2008, 68, 504-16.
28. Schot, J.; Kanger, L.; Verbong, G. The roles of users in shaping transitions to new energy systems. Nat. Energy. 2016, 1, BFnenergy201654.
29. Axsen, J.; Kurani, K. S. Interpersonal influence within car buyers’ social networks: applying five perspectives to plug-in hybrid vehicle drivers. Environ. Plan. A. 2012, 44, 1047-65.
30. Liu, X.; Roberts, M. C.; Sioshansi, R. Spatial effects on hybrid electric vehicle adoption. Transport. Res. D-Tr. E. 2017, 52, 85-97.
31. Ryghaug, M.; Skjølsvold, T. M. How policies and actor strategies affect electric vehicle diffusion and wider sustainability transitions. Proc. Natl. Acad. Sci. U. S. A. 2023, 120, e2207888119.
32. Hardman, S. Understanding the impact of reoccurring and non-financial incentives on plug-in electric vehicle adoption - a review. Transport. Res. A-Pol. 2019, 119, 1-14.
33. Central Pricing Catalogue (Draft for Soliciting Amendments) (2019). Available from: https://zfxxgk.ndrc.gov.cn/upload/images/202111/202111231125924.pdf (accessed on 2026-8-17).
35. Hoogland, K.; Kurani, K. S.; Hardman, S.; Chakraborty, D. If you build it, will they notice? Transp. Res. Interdisc. 2024, 23, 101007.
36. IEA. Global EV Outlook 2026. 2026. https://www.iea.org/reports/global-ev-outlook-2026 (accessed on 2026-8-17).
37. CAUPD, Vehicles NBDAfNE, Beijing NavInfo Co. L. Monitoring Report on Charging Infrastructure in Major Chinese Cities in 2024. 2024. https://www.199it.com/archives/1735179.html (accessed on 2026-8-17).
38. He, L.; Yang, S. Policy scenario analysis of achieving the "dual carbon" goal for the road transportation sector in China. DESD 2024, 2, 29.
Cite This Article
 Open Access
How to Cite
Download Citation
Export Citation File:
Type of Import
Tips on Downloading Citation
Citation Manager File Format
Type of Import
Direct Import: When the Direct Import option is selected (the default state), a dialogue box will give you the option to Save or Open the downloaded citation data. Choosing Open will either launch your citation manager or give you a choice of applications with which to use the metadata. The Save option saves the file locally for later use.
Indirect Import: When the Indirect Import option is selected, the metadata is displayed and may be copied and pasted as needed.
About This Article
Copyright

Data & Comments
Data
0











Comments
Comments must be written in English. Spam, offensive content, impersonation, and private information will not be permitted. If any comment is reported and identified as inappropriate content by OAE staff, the comment will be removed without notice. If you have any queries or need any help, please contact us at [email protected].