

fig4
From: A novel allocation method and critical transport distance for industrial by-products in concrete
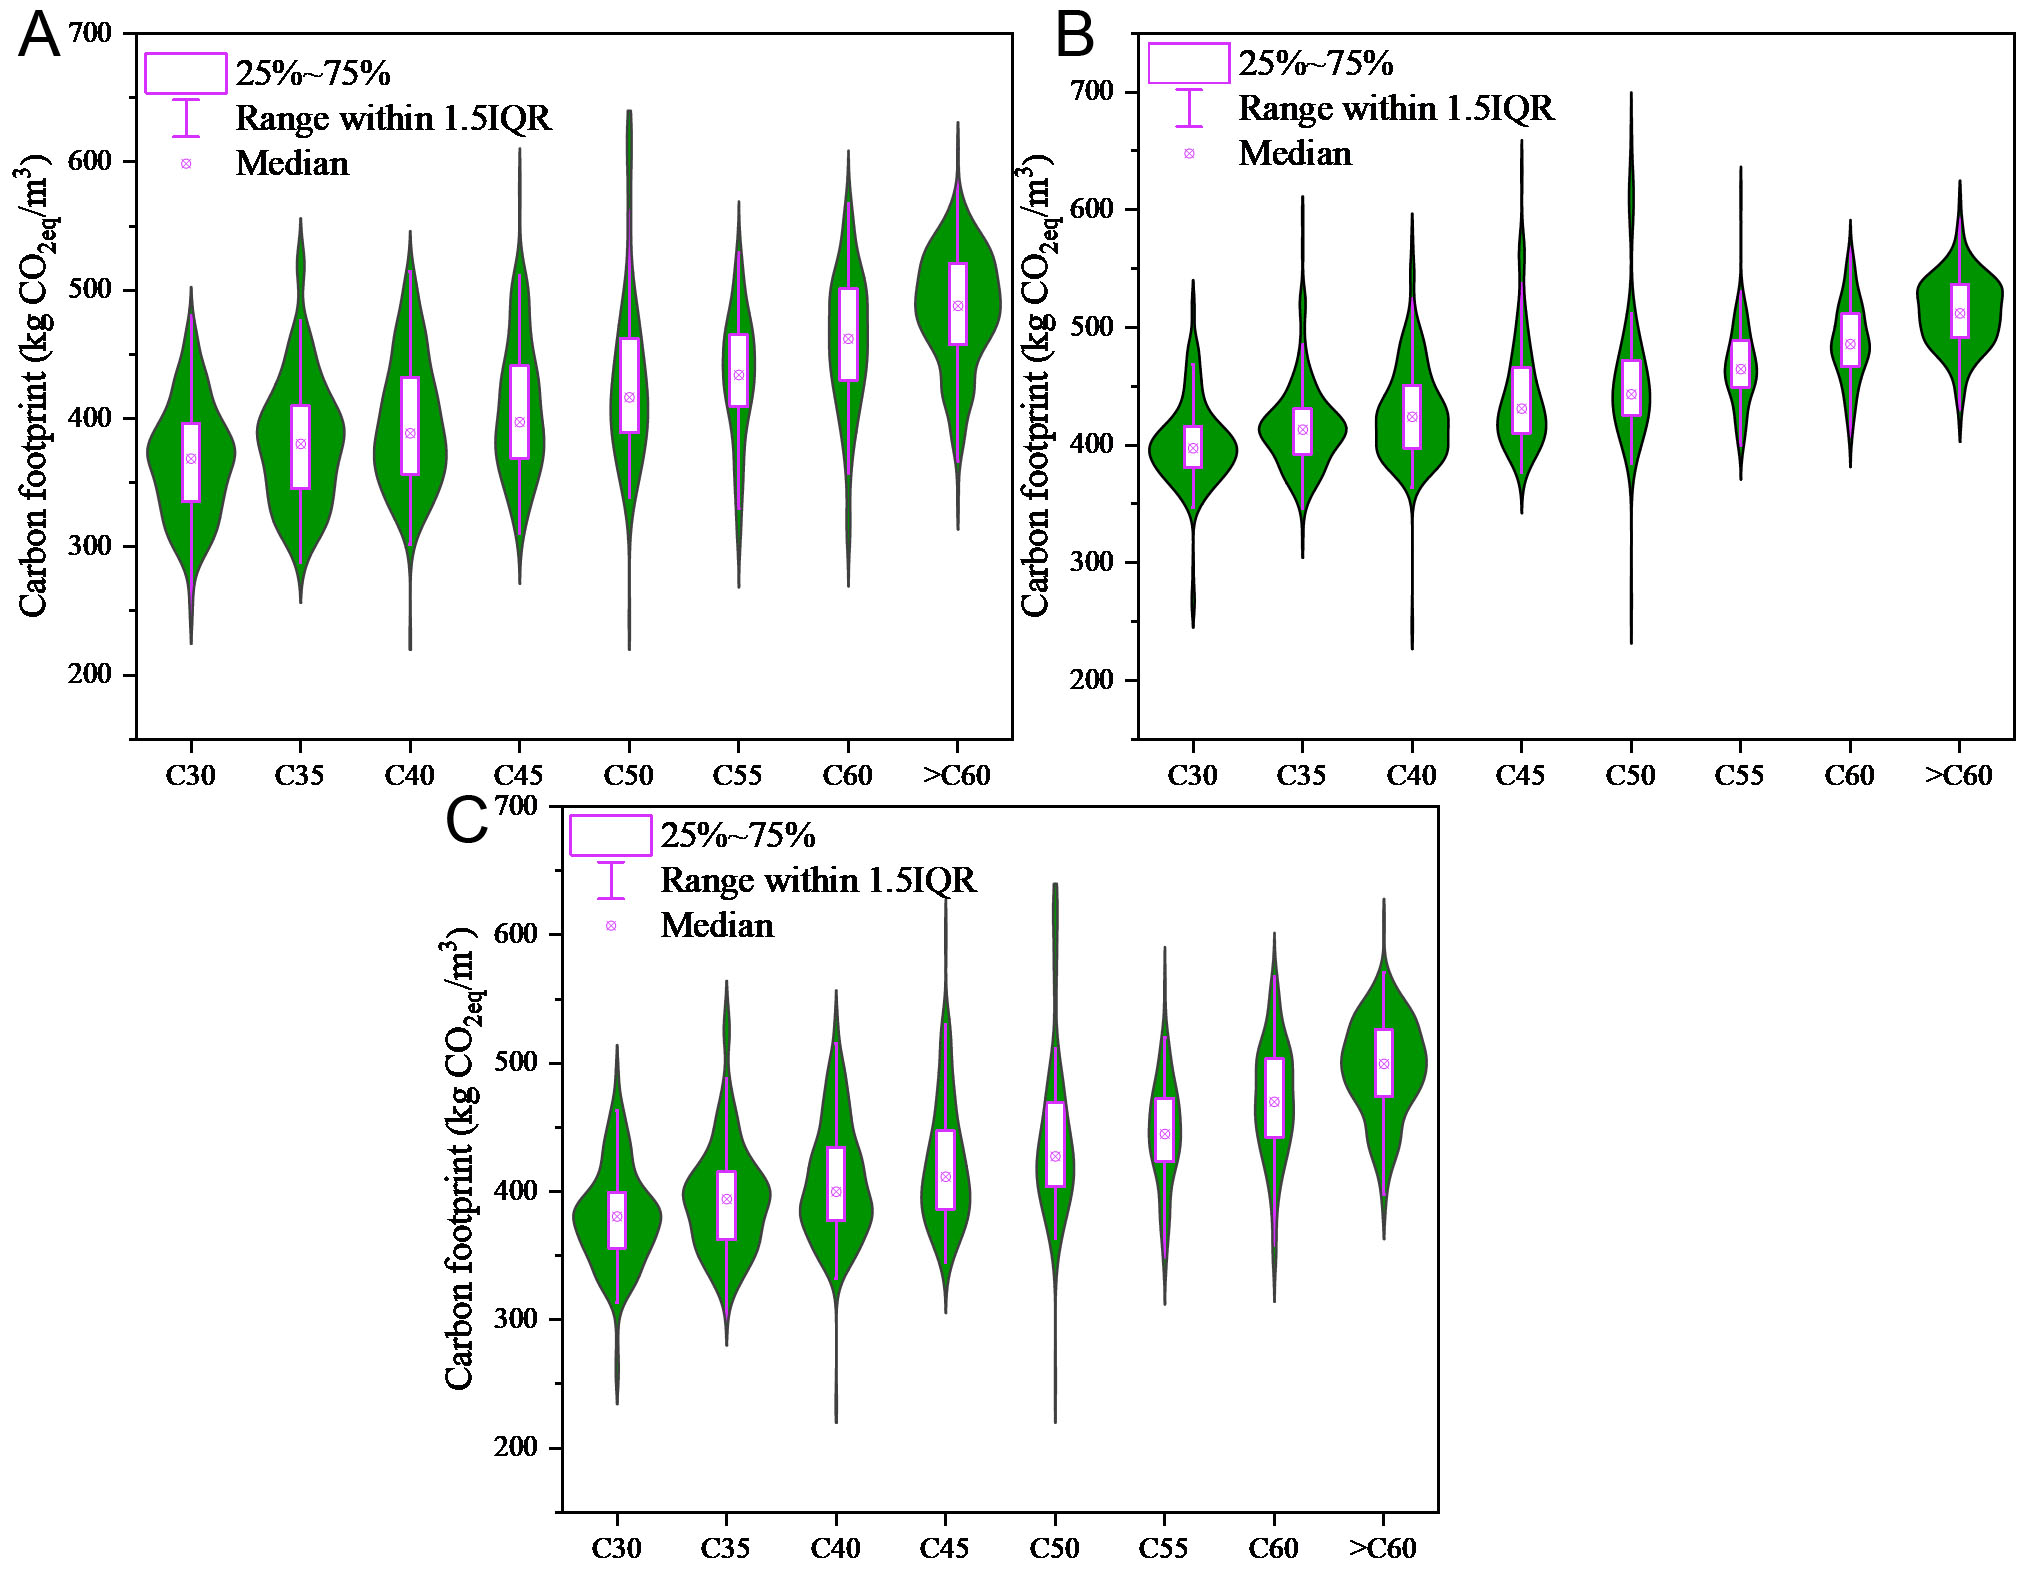
Figure 4. Carbon footprint distribution characteristics under different allocation principles. (A) Violin plot of carbon footprint distribution under the C0 allocation principle; (B) Violin plot of carbon footprint distribution under the Ce allocation principle; (C) Violin plot of carbon footprint distribution under the Cc allocation principle. The green shaded regions represent the kernel density estimation contours, which indicate the probability density distribution of the carbon footprint data, the wider the green area, the more concentrated the data points at that value. IQR: Interquartile range.





