

fig5
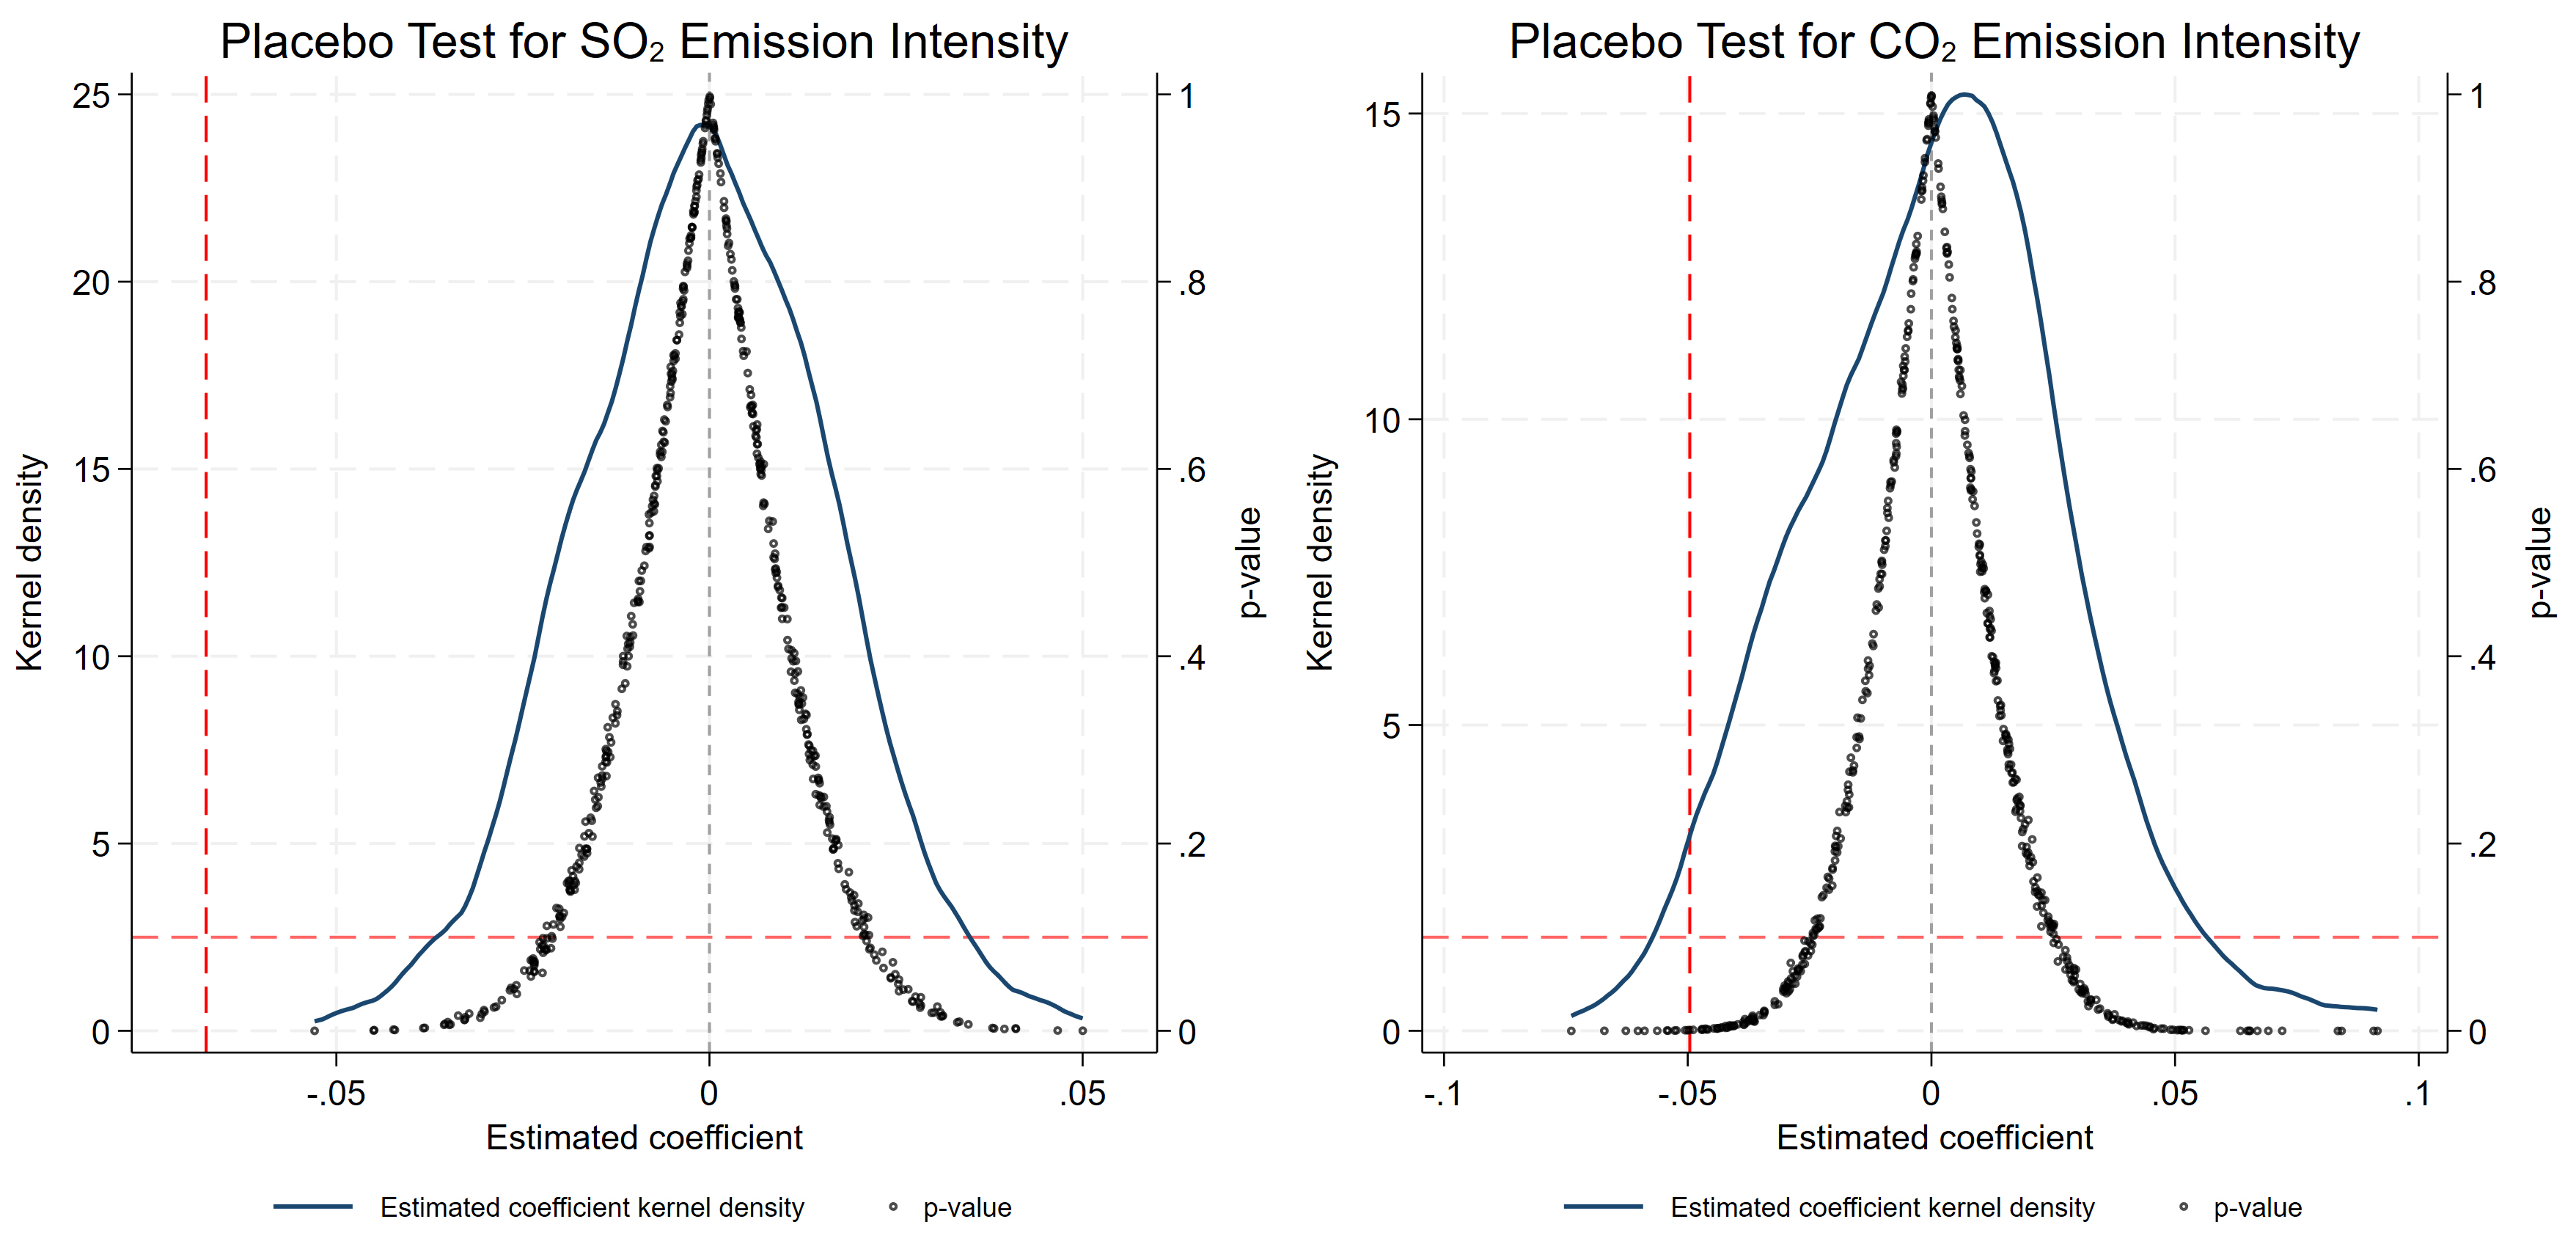
Figure 5. SO2 and CO2 emission intensity placebo test. The gray vertical dashed lines mark zero, the red vertical dashed lines indicate the actual baseline estimates, and the red horizontal dashed lines denote the P = 0.10 threshold.
Figure 5. SO2 and CO2 emission intensity placebo test. The gray vertical dashed lines mark zero, the red vertical dashed lines indicate the actual baseline estimates, and the red horizontal dashed lines denote the P = 0.10 threshold.


All published articles are preserved here permanently
https://www.portico.org/publishers/oae/


