

fig3
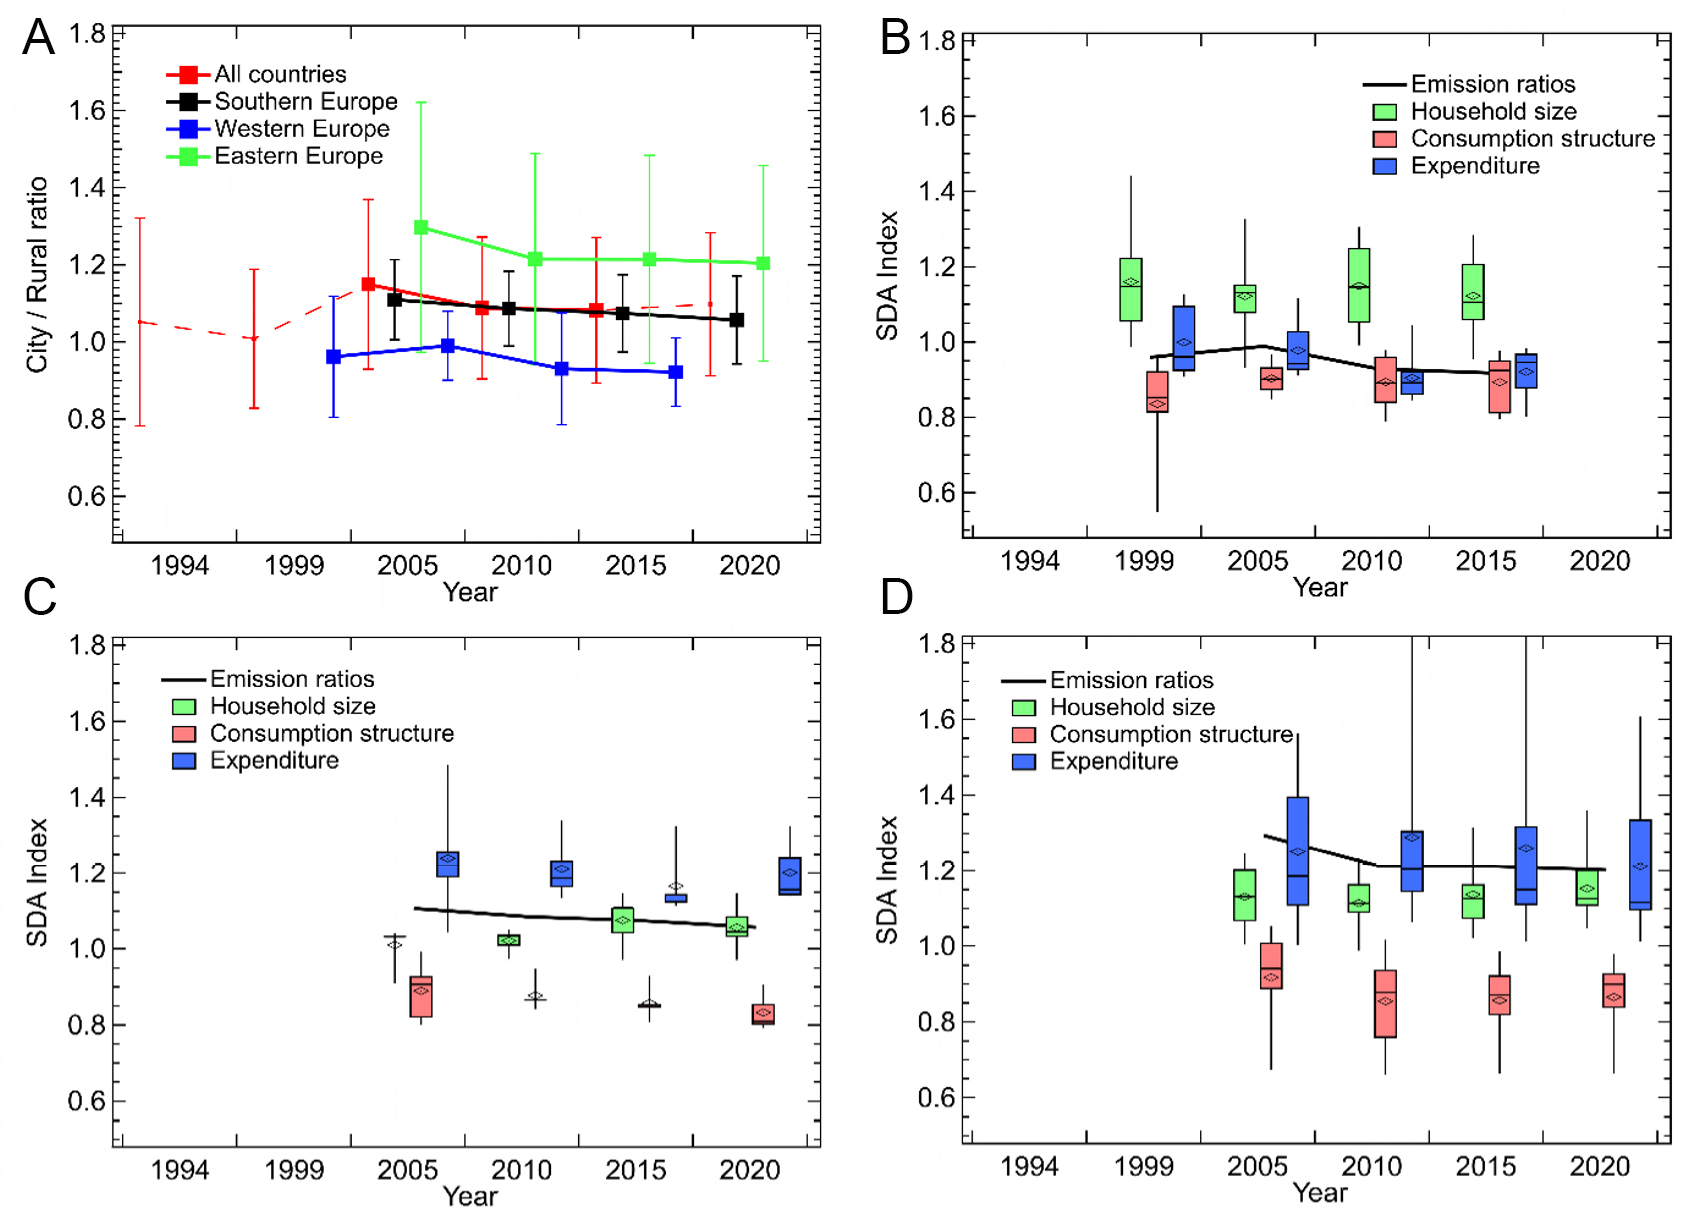
Figure 3. Emission ratios between urban and rural residents in Europe, grouped by geographical region (A), results of structural decomposition analysis as box plots for Western (B), Southern (C), and Eastern Europe (D), respectively. The dashed red line in (A) shows the average ratio when considering only the countries that had data in these years. Error bars are given as 1 standard deviation of the results from the respective countries in the grouping. The central line in the box plots corresponds to the median value, with the black diamond representing the mean, Whiskers extend between the minimum and maximum data points. Box plots in b-d were made for 8, 5 and 10 countries for Western, Southern and Eastern Europe, respectively, and are presented at intervals of 5 years.





