

fig2
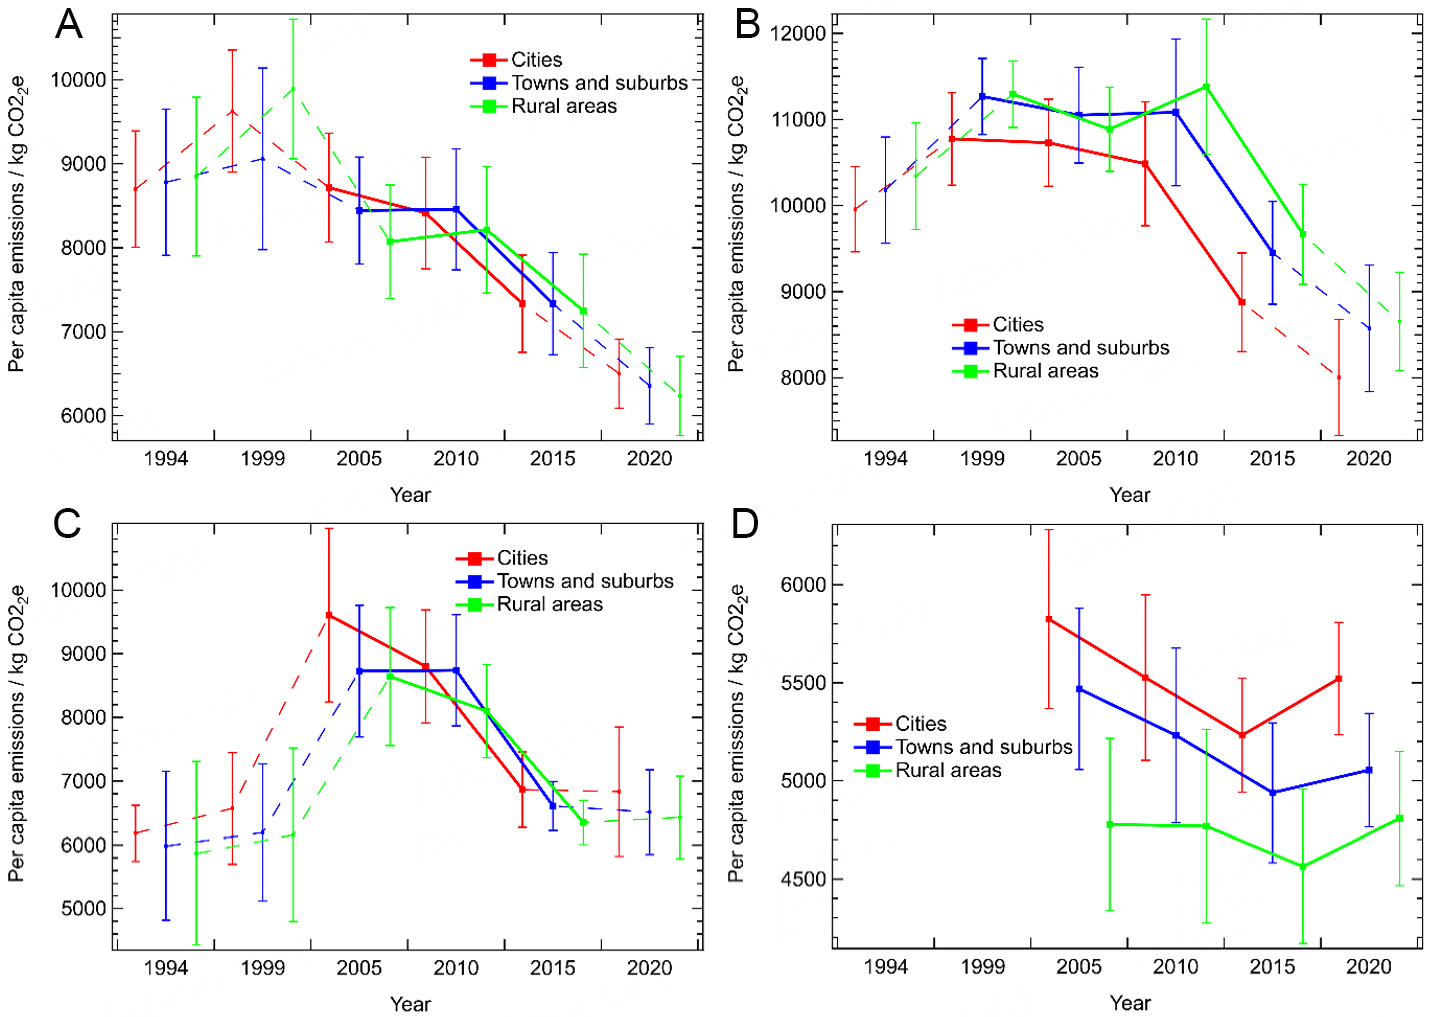
Figure 2. Emission averages against urban density for all of Europe (A), Western Europe (B), Southern Europe (C), and Eastern Europe (D). Emissions for city, towns and suburbs and rural residents are shown in red, blue, and green, respectively. Solid bars represent results drawn from a consistent pool of countries, with the dashed lines showing the results for a reduced pool of countries because of missing data. Error bars are calculated using the standard error on the mean.





