


fig2
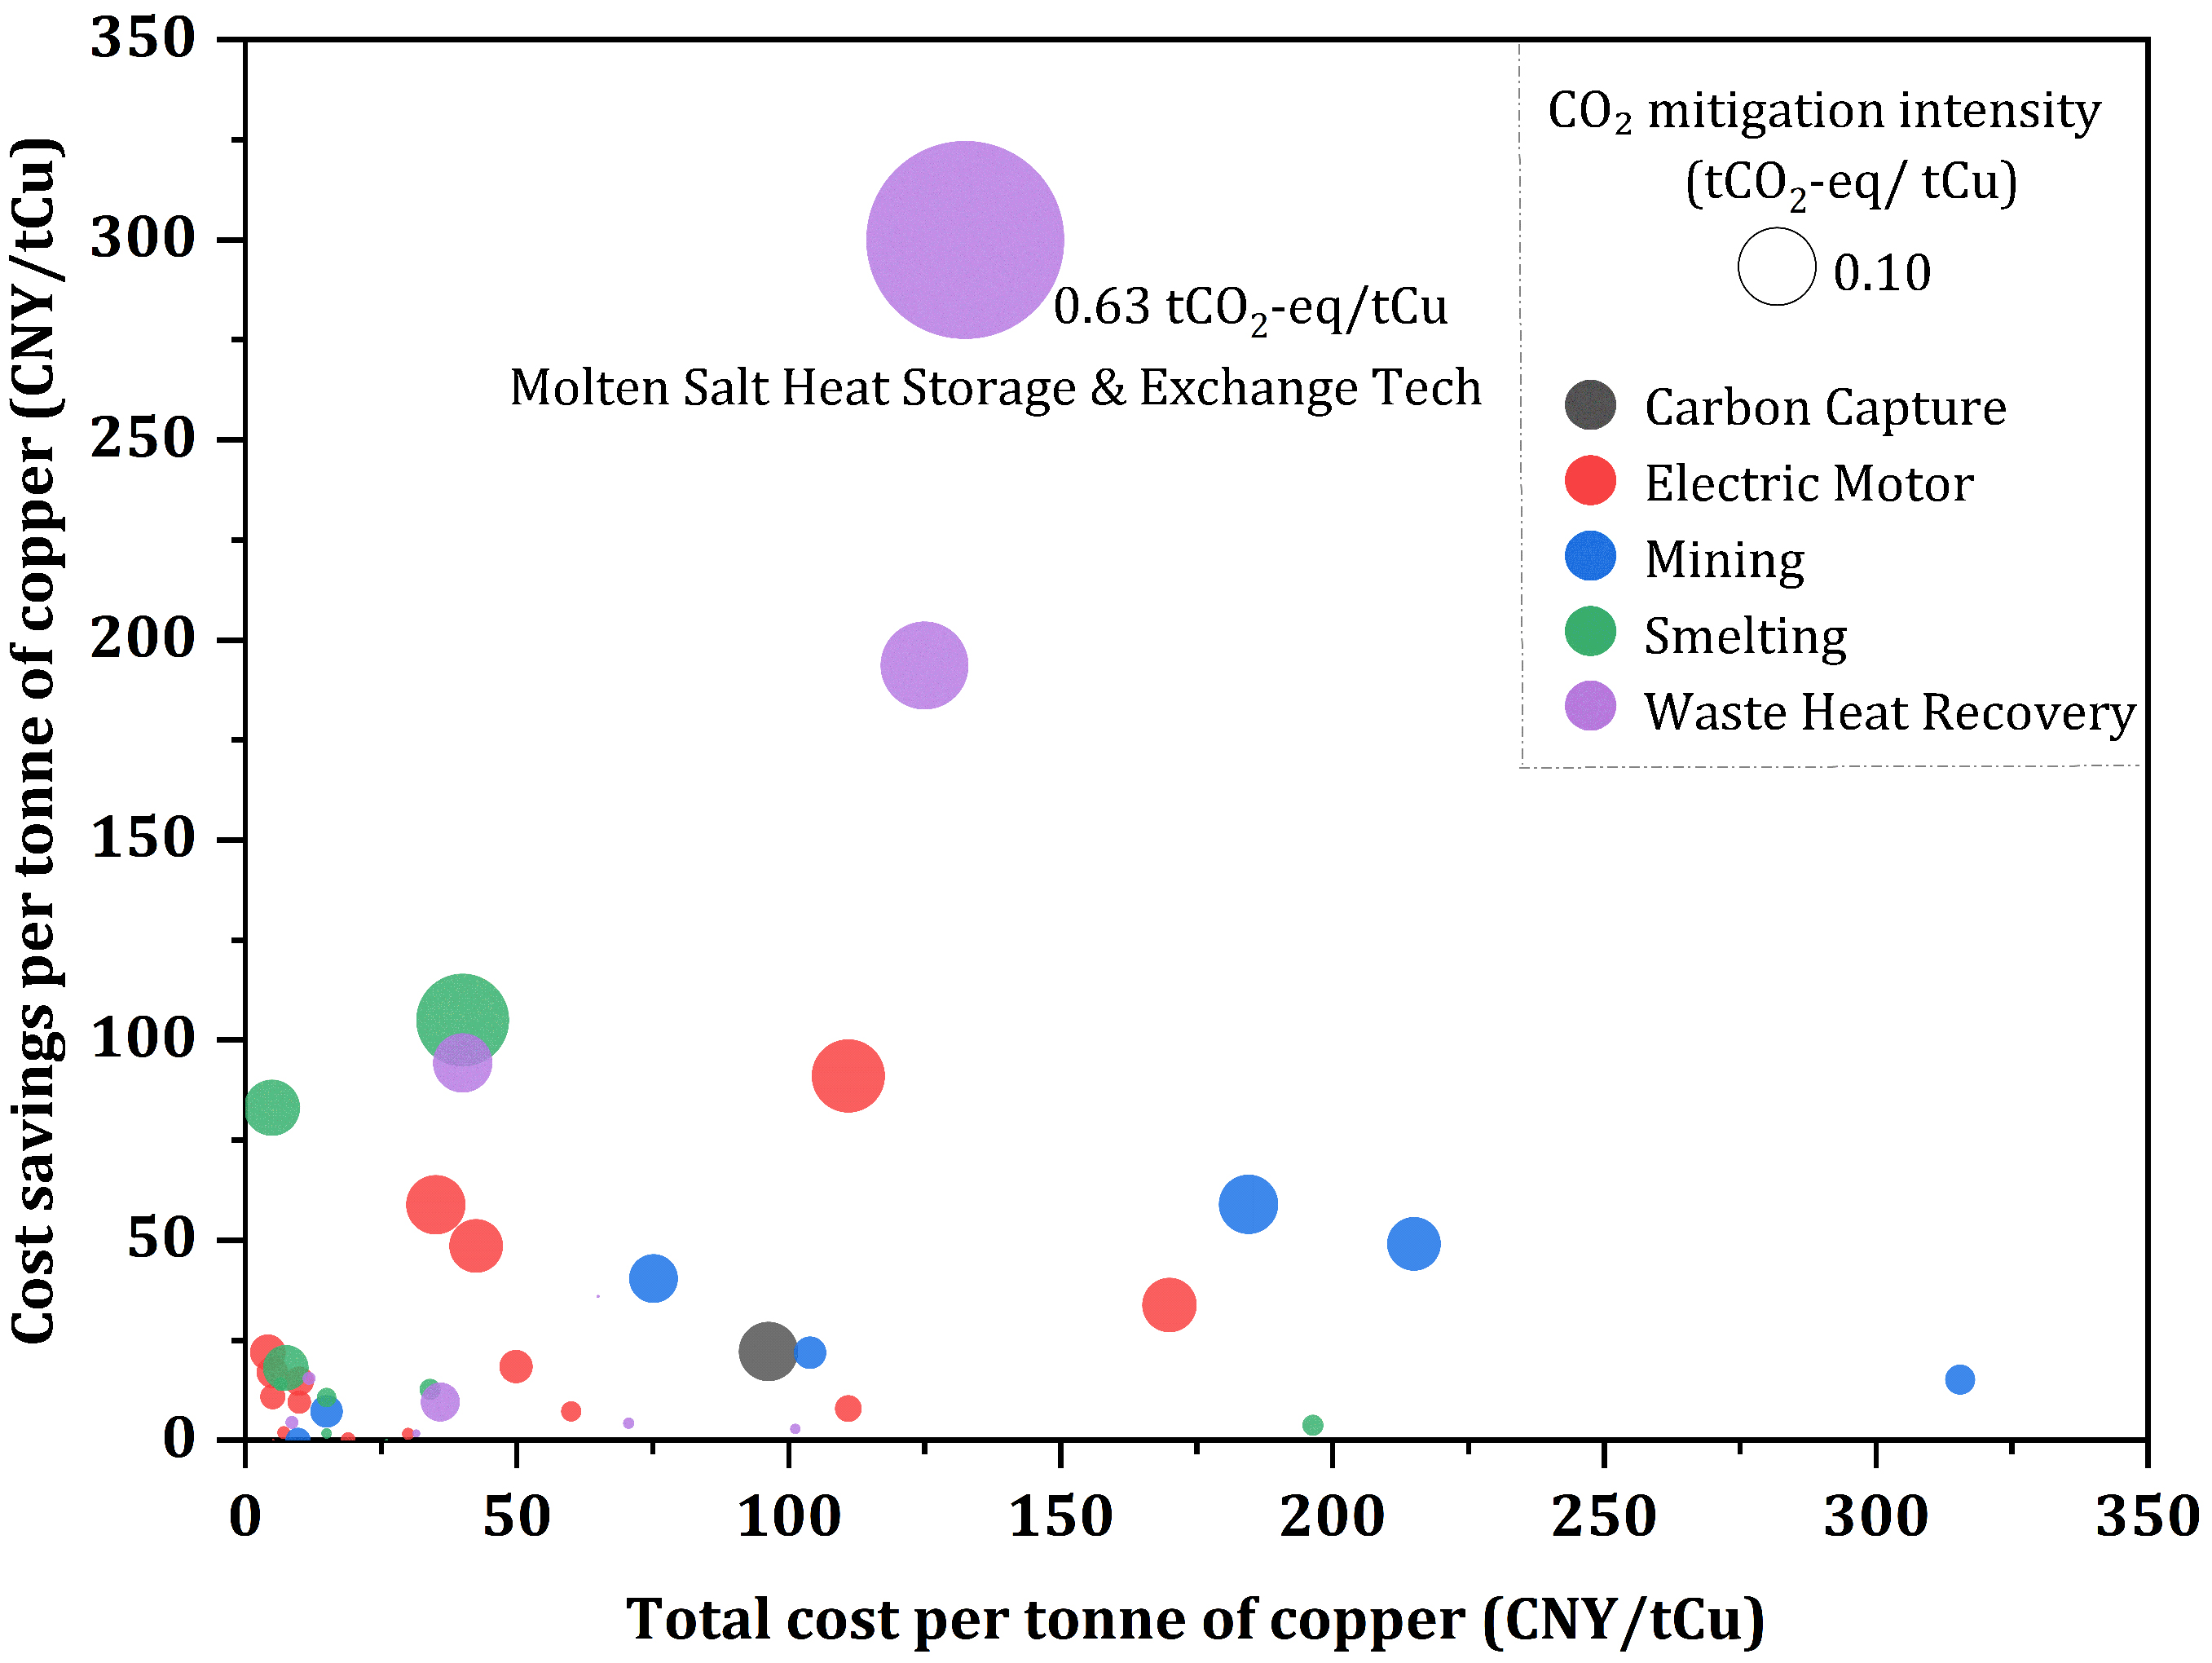
Figure 2. Comparison of costs, benefits, and CO2 mitigation intensity across individual technologies (Bubble size indicates CO2 mitigation intensity).
Figure 2. Comparison of costs, benefits, and CO2 mitigation intensity across individual technologies (Bubble size indicates CO2 mitigation intensity).


All published articles are preserved here permanently
https://www.portico.org/publishers/oae/


