
fig4
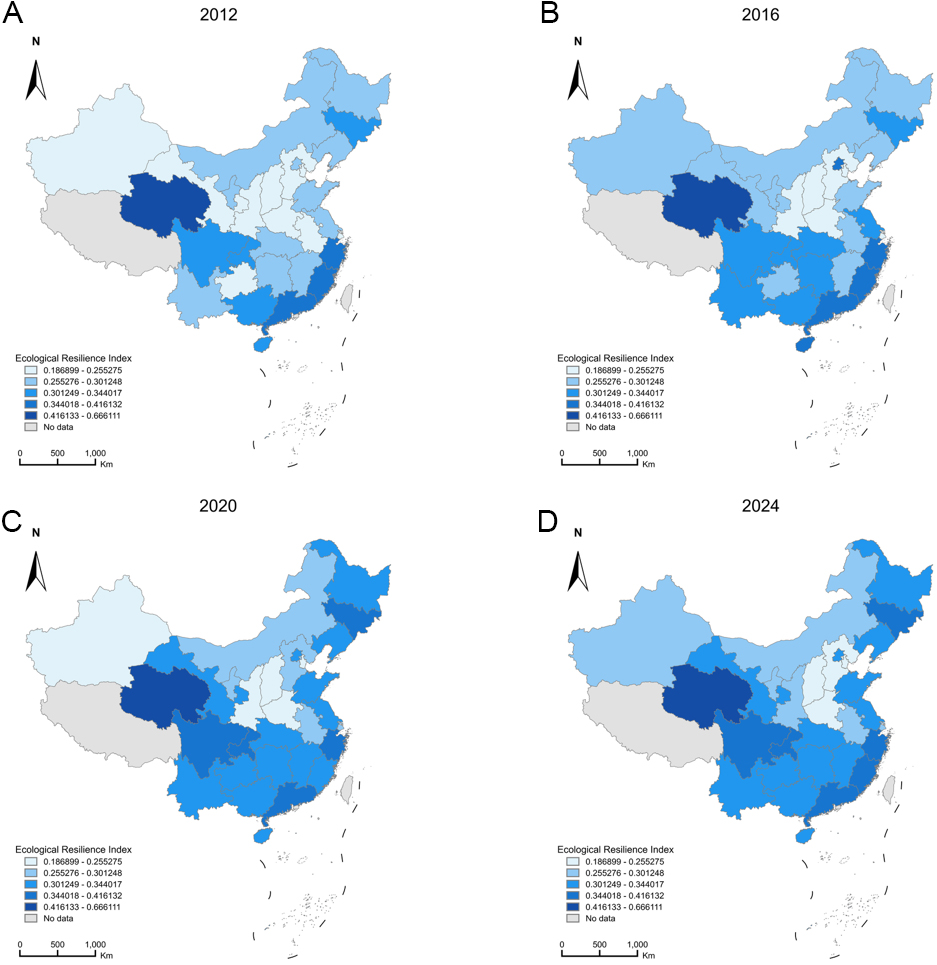
Figure 4. Spatial evolution of the composite provincial ecological resilience index in China, 2012–2024. Provinces for which the index could not be computed (Tibet, Taiwan, Hong Kong and Macao) are shown in grey. Each mapped year includes n = 30 provinces with available scores (N = 390 province-year observations over 2012–2024). Administrative boundaries, including the national boundary and the dashed-line boundary in the South China Sea, follow the standard map of China issued by the Ministry of Natural Resources of China under approval number GS(2023)2765, obtained from the Standard Map Service at http://bzdt.ch.mnr.gov.cn/ (accessed 6 September 2026); the boundaries were not modified. Map lines do not necessarily depict accepted national boundaries.