
fig4
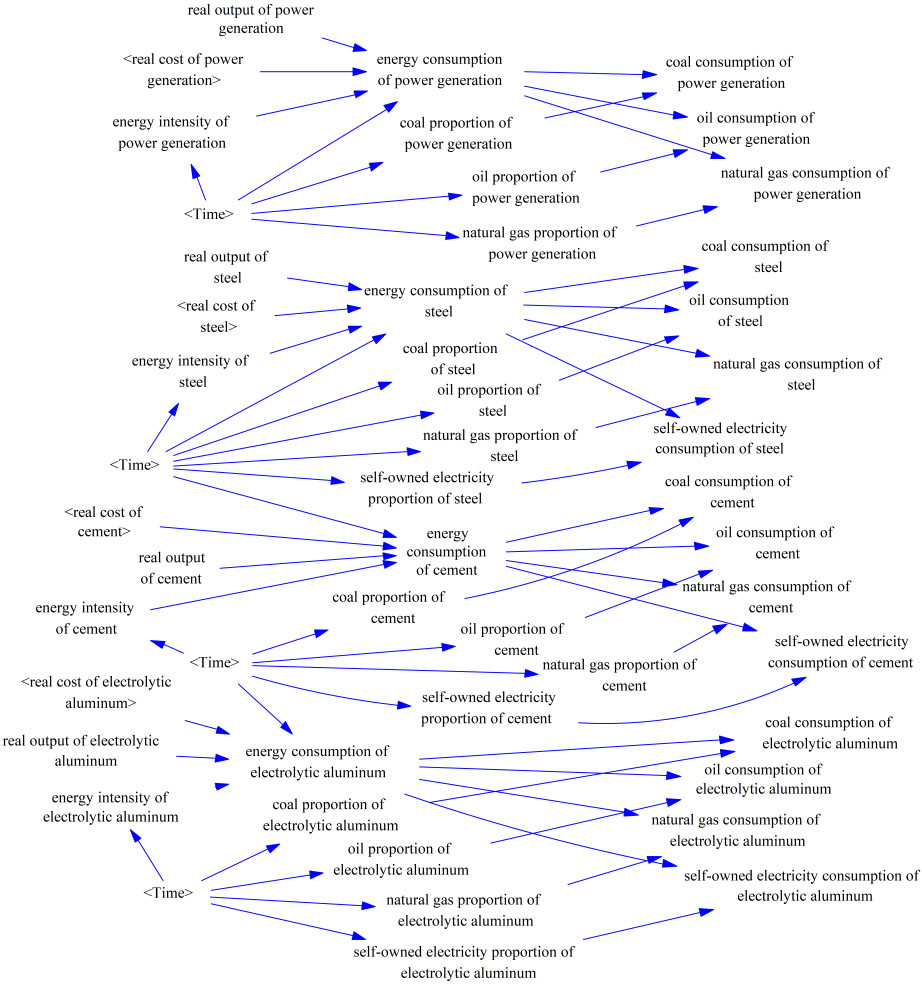
Figure 4. Stock flow diagram of the energy subsystem. <Time> denotes simulated time, and <real cost > variables represent inflation-adjusted costs expressed in constant 2005 CNY.
Figure 4. Stock flow diagram of the energy subsystem. <Time> denotes simulated time, and <real cost > variables represent inflation-adjusted costs expressed in constant 2005 CNY.


All published articles are preserved here permanently
https://www.portico.org/publishers/oae/